Run Aidbox with OpenTelemetry locally
Intro
This guide helps you to launch and explore the Aidbox observability features locally.
It introduces you to:
- The Aidbox installation process with Docker & Docker Compose,
- Logs & metrics & traces exporting to Elasticsearch & Prometheus & Zipkin using OpenTelemetry collector service.
.avif)

Please make sure that both Docker & Docker Compose are installed.
Prerequisites
- Docker
- Cloned repository: Github: Aidbox/examples
- Working directory:
OpenTelemetry
To clone the repository and navigate to the OpenTelemetry directory, run:
git clone git@github.com:Aidbox/examples.git && cd examples/OpenTelemetry
1. Start Aidbox and demo components with Docker Compose
docker compose up --force-recreate
Wait until all components are pulled and started.
2. Activate Aidbox
Open Aidbox on http://localhost:8080 address, activate it, and login with admin/password credentials
3. Discover Aidbox logs with Kibana
Kibana should be available on http://localhost:5602 address. To see logs in Kibana we should
- make sure that logs are coming to Elasticsearch and then
- create a data view to observe over logs.
Go to Index Management page in Kibana (Menu → Stack Management → Index Management). You should see aidbox_logs index there.
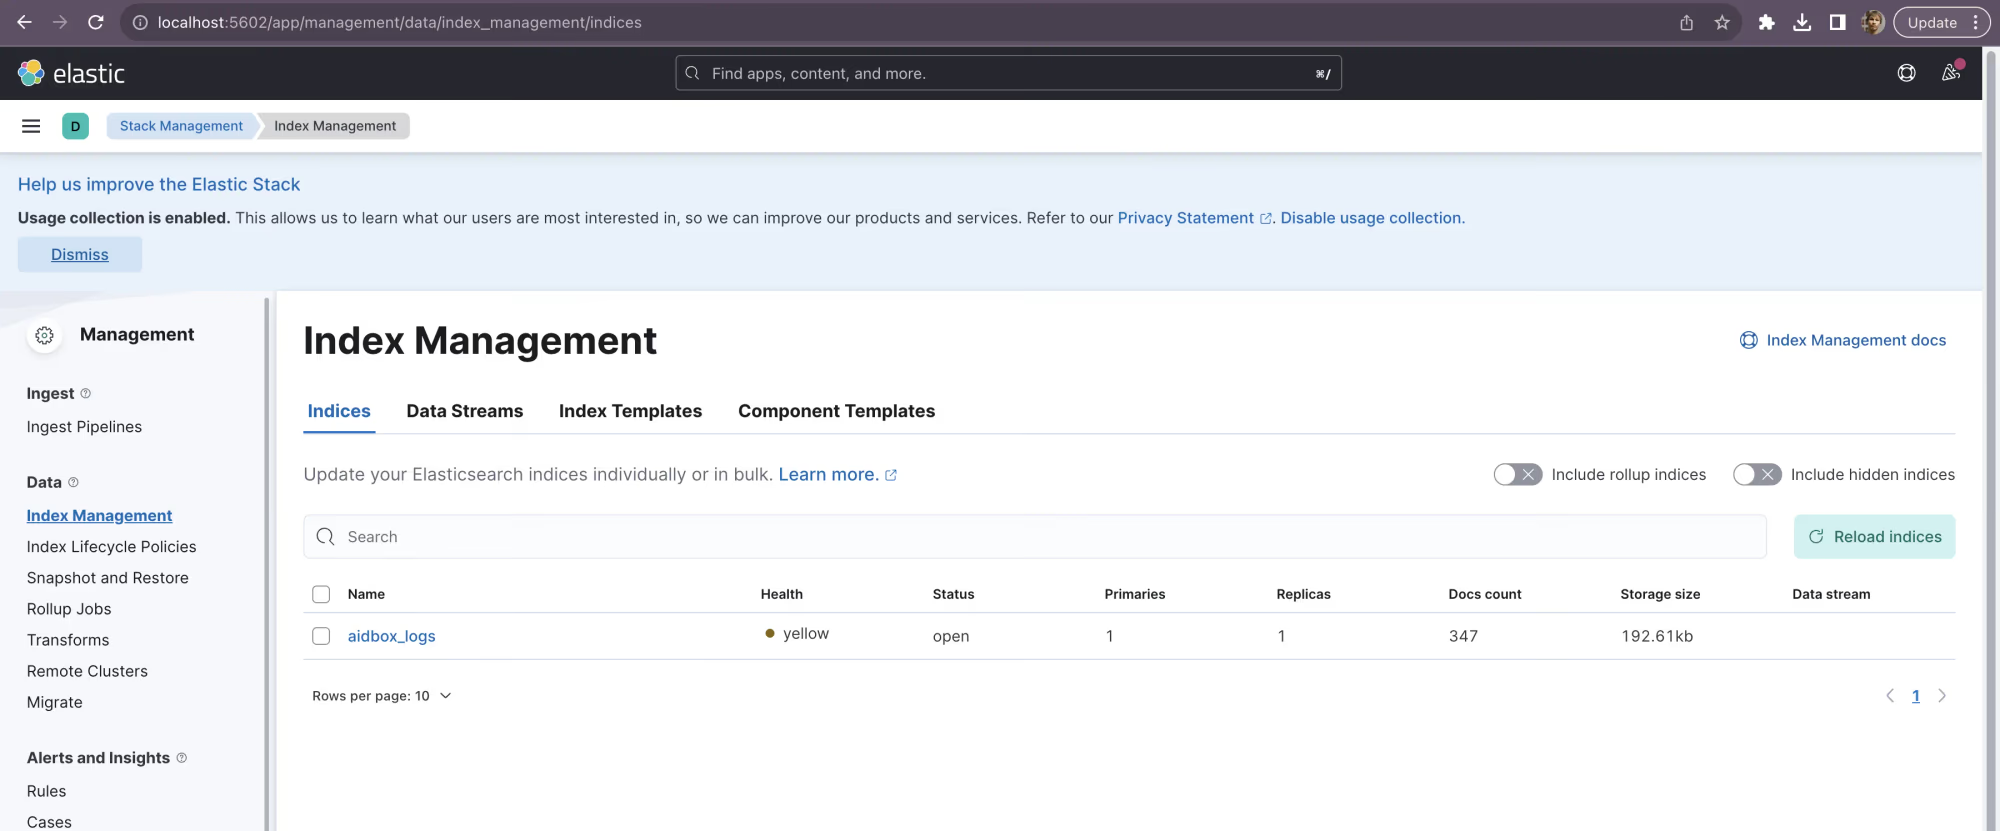
Index management page
Then we should go to Data Views page (Menu → Stack Management → Data Views) and create a data view there.
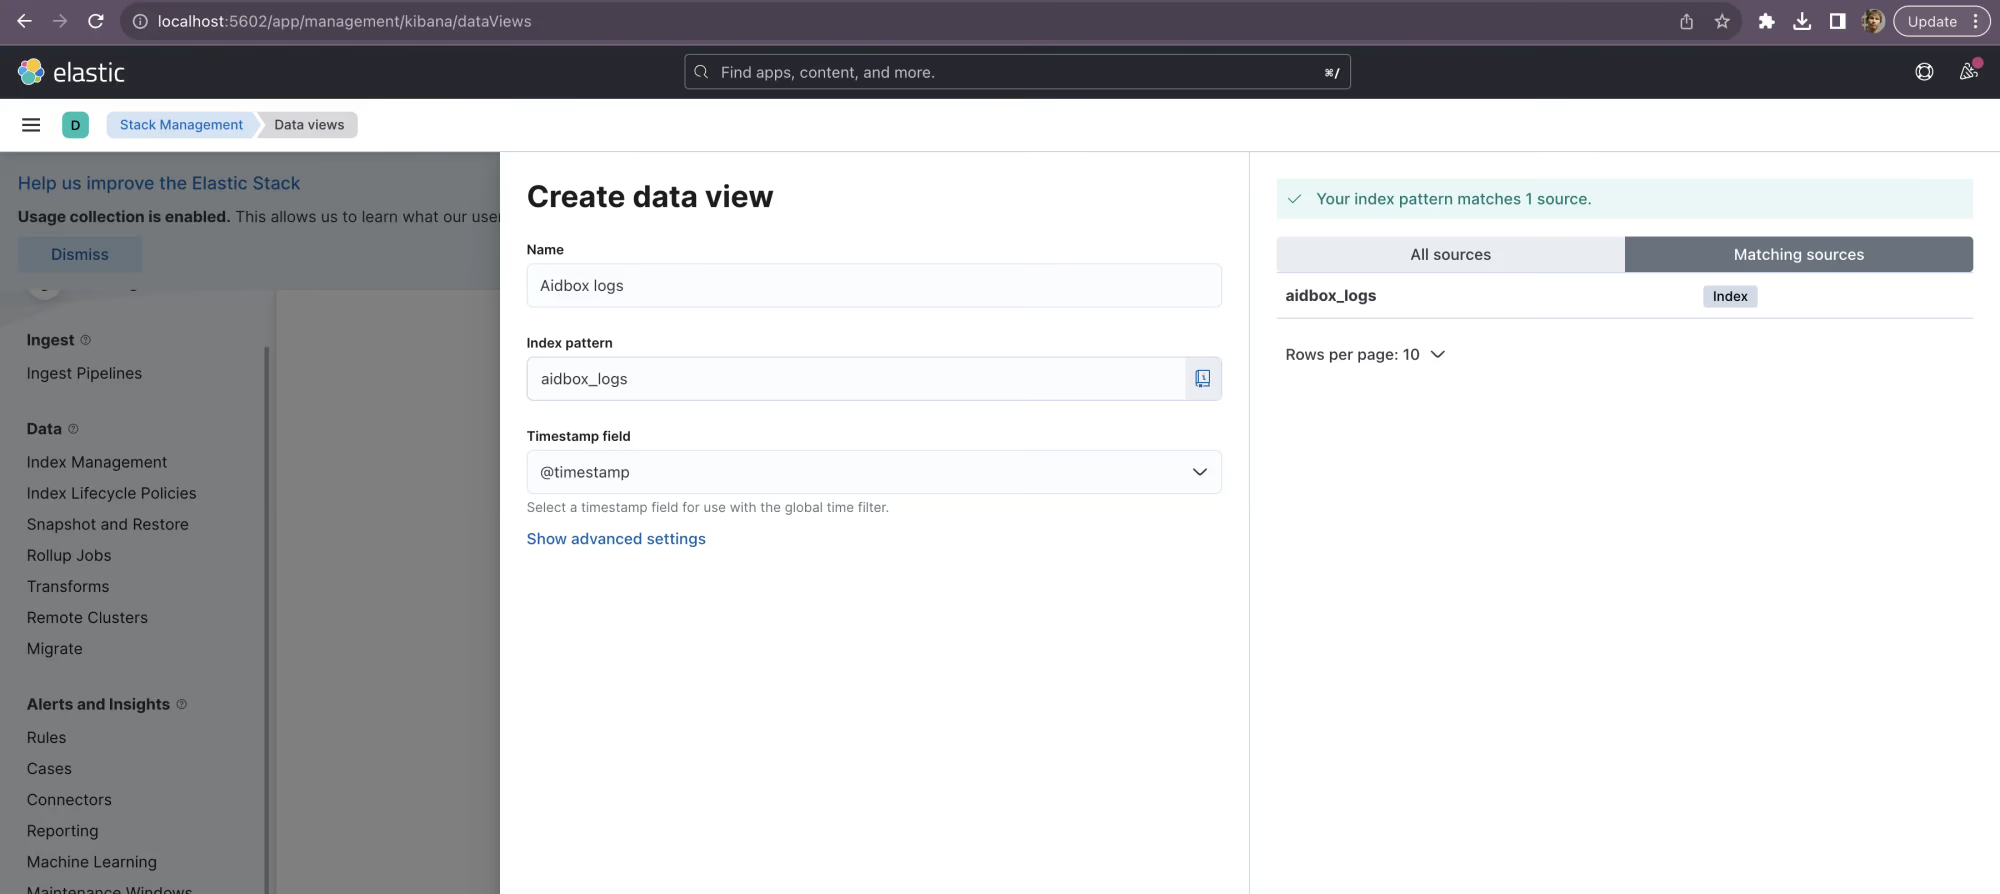
Data view creation
Then go to Discover page (Menu → Discover) and observe your logs.
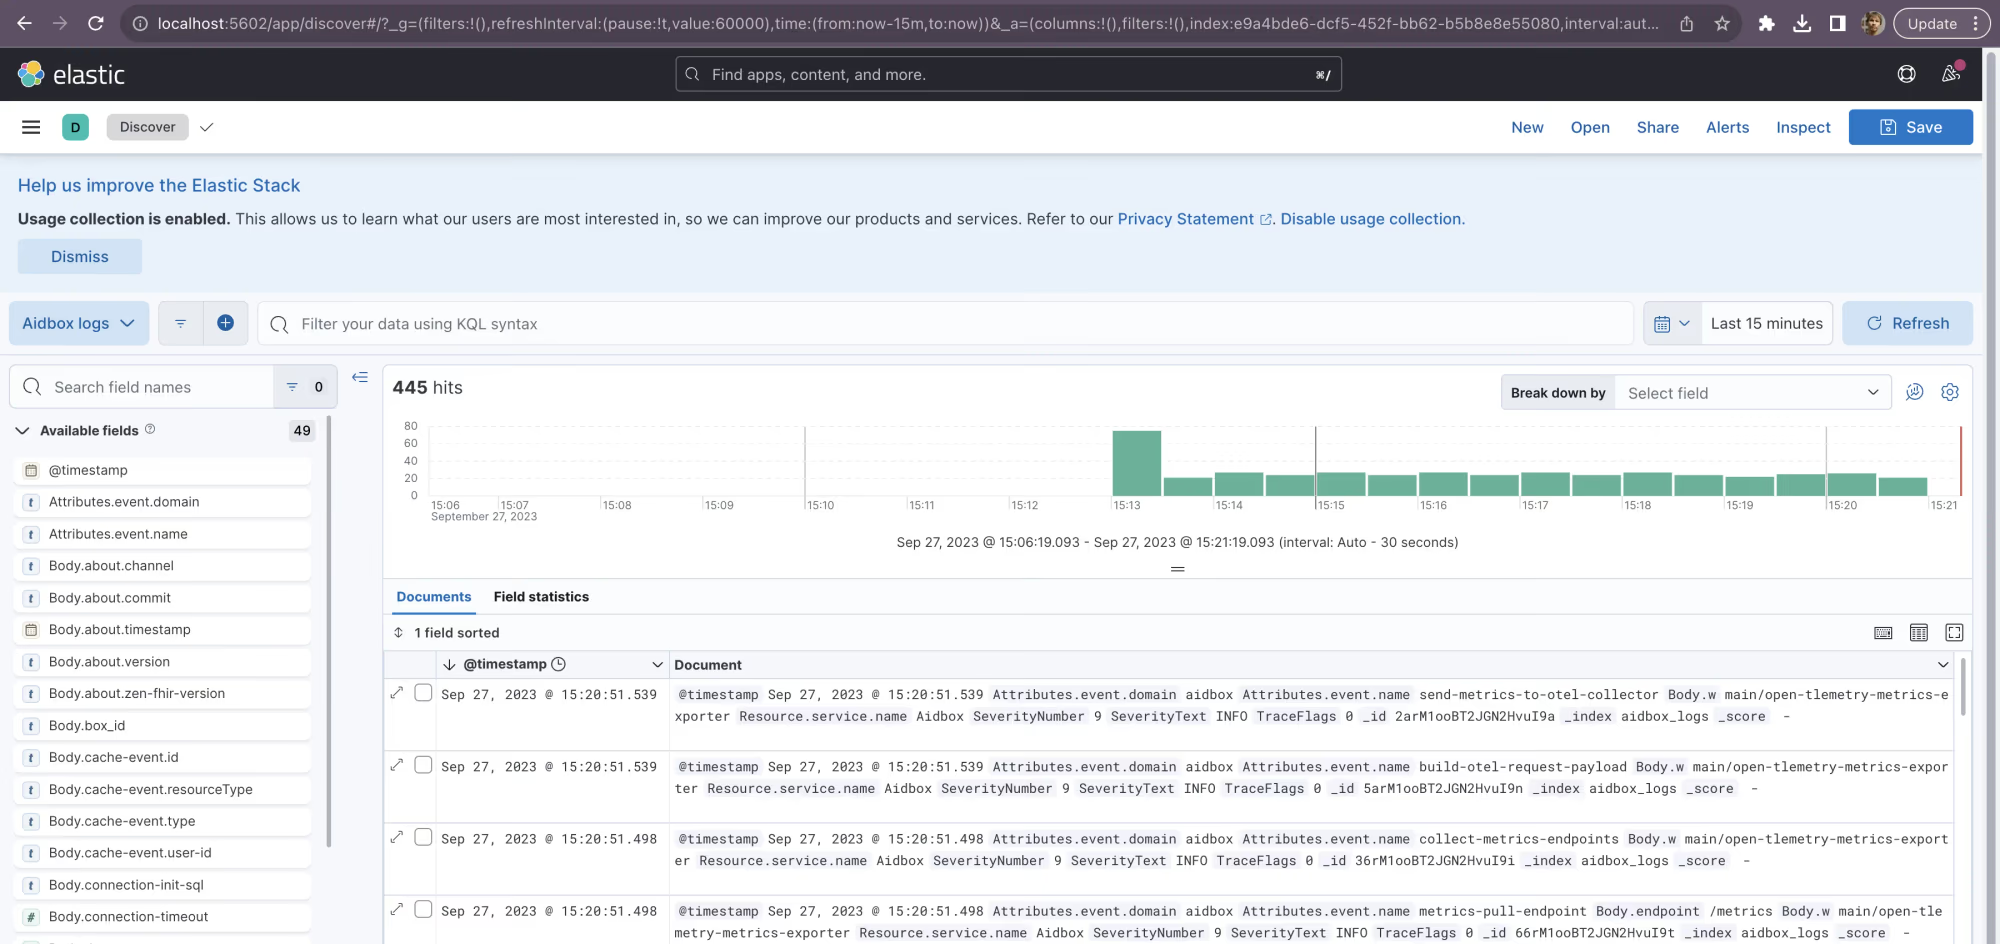
Log discover page
4. Discover Aidbox metrics with Grafana
To visualize Aidbox metrics, import the Aidbox Metrics Dashboard from Grafana Dashboards. Navigate to Dashboards and click New -> Import. Enter the dashboard ID 24752 and click Load. Then select the Prometheus data source and click Import.
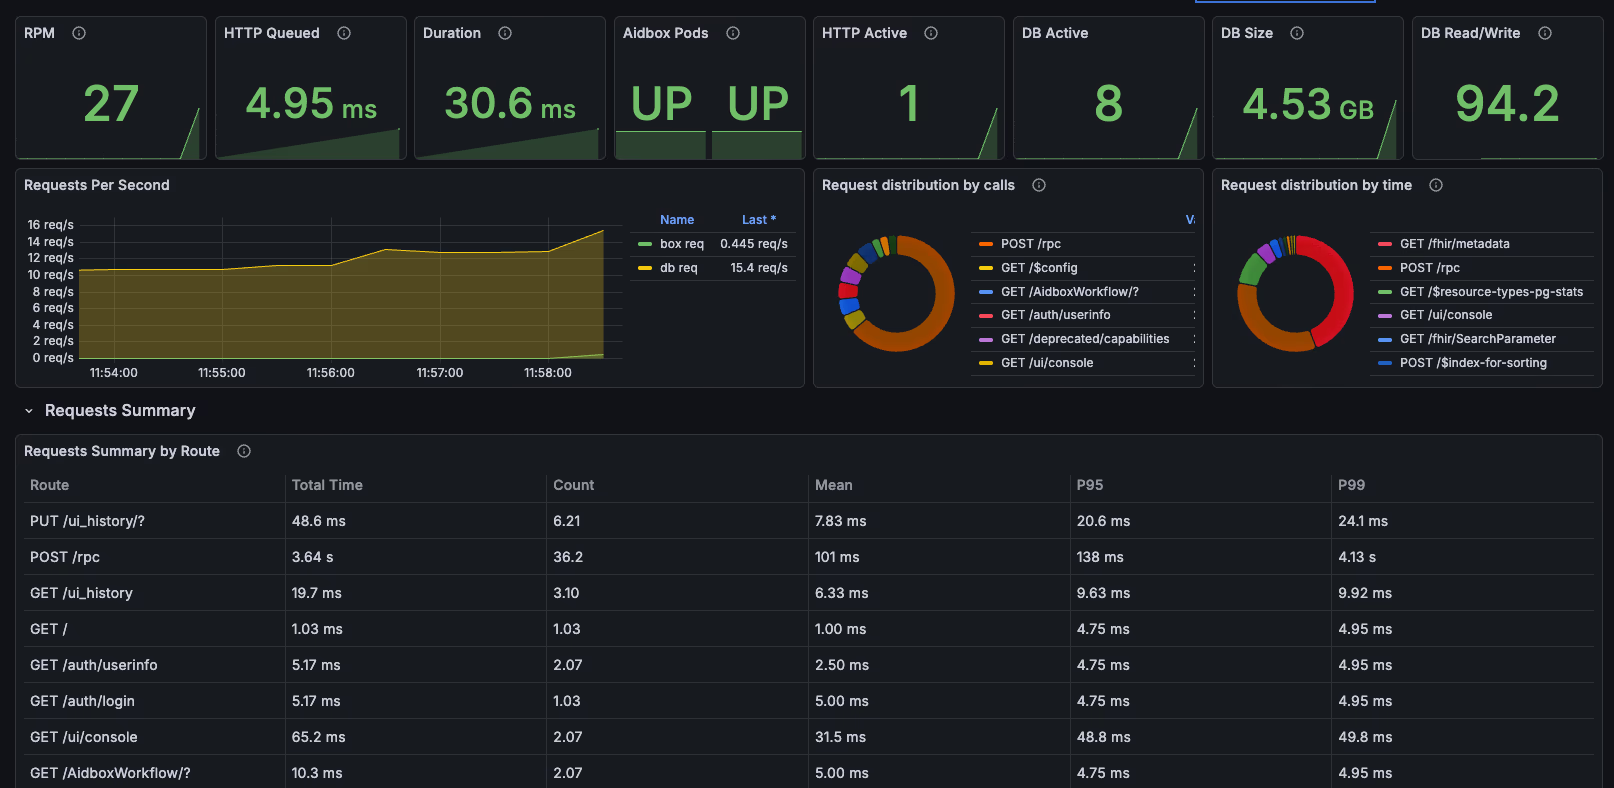
Aidbox Metrics Dashboard
5. Discover Aidbox traces with Zipkin
Zipkin should be available on http://localhost:9411/ address. To see traces in Zipkin click the Run query button.
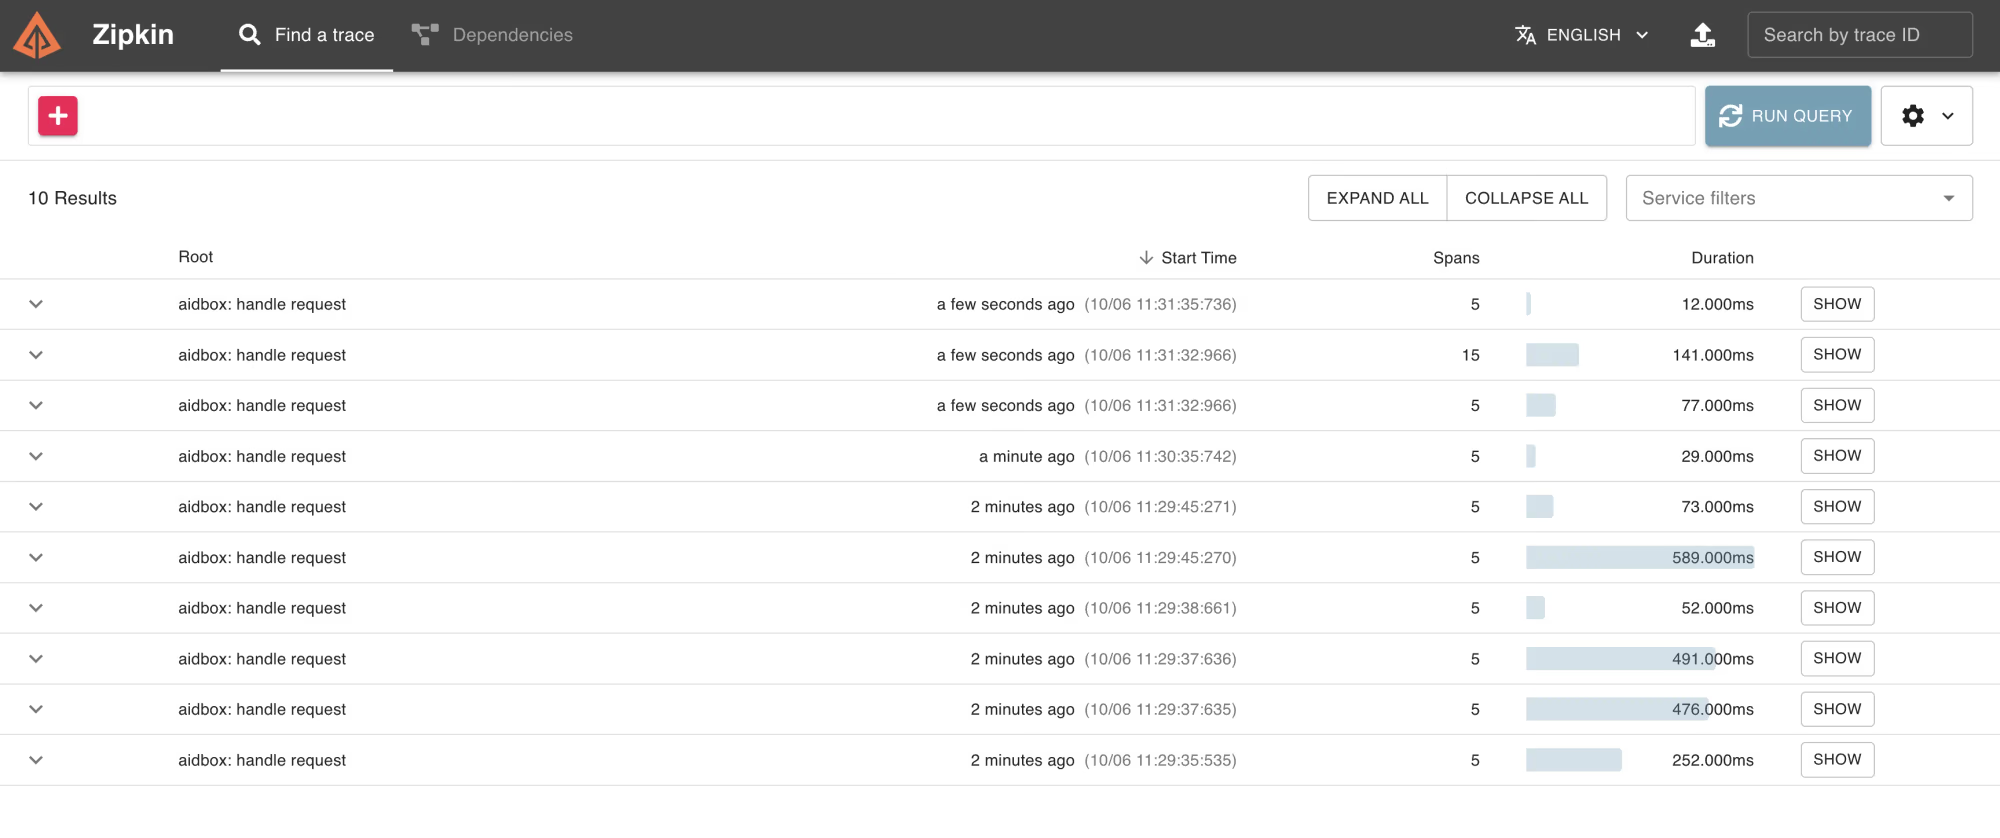
Traces list in Zipkin
Click the Show button to see all spans of a certain request.
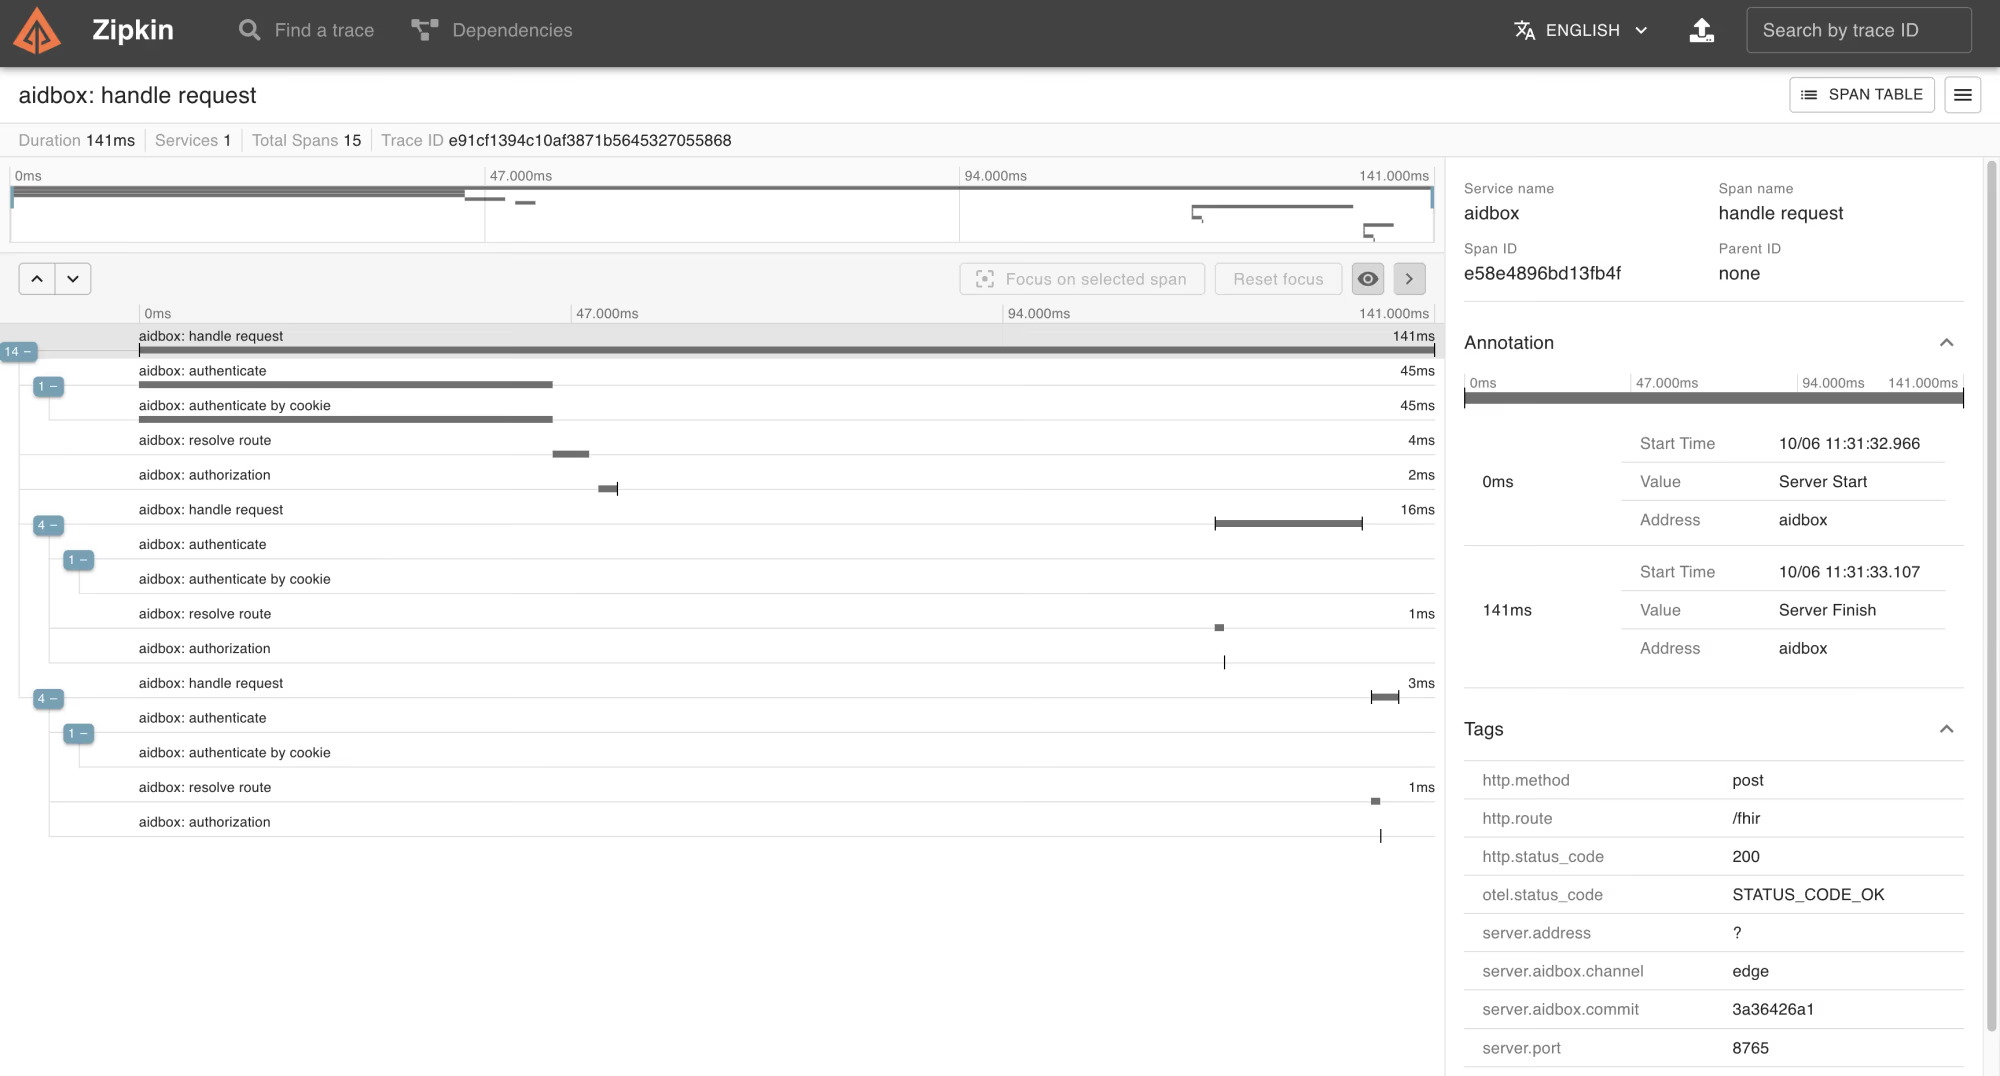
Trace view in Zipkin