Export logs to Datadog tutorial
Set up Datadog API Key
You need to enable Datadog Logs API and create an API Key
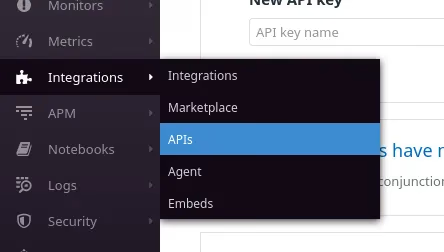
To create a new API key go to Datadog then go to Integrations -> APIs:
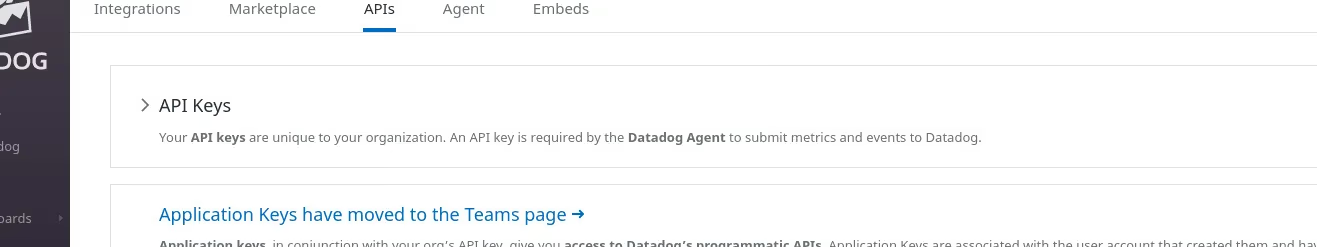
Click API Keys
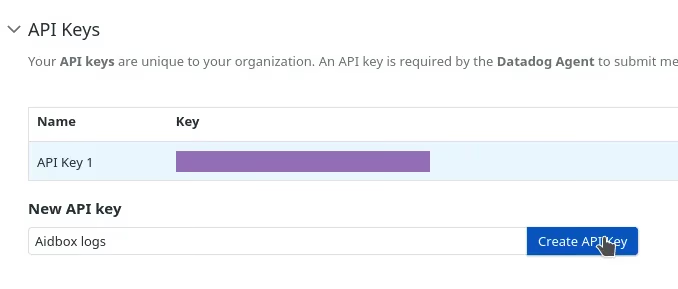
Enter the name of the new key and click Create API Key
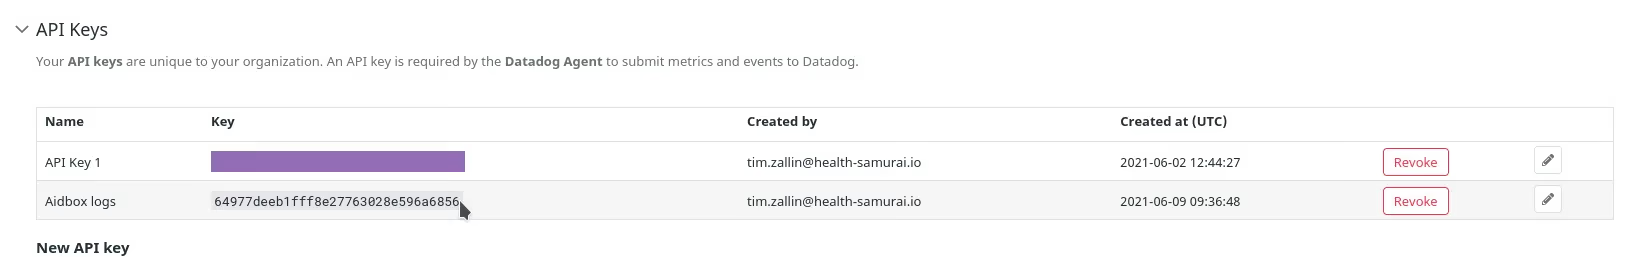
Copy the newly generated key
Configure Aidbox
Set the AIDBOX_DD_API_KEY environment variable to the Datadog API Key.
For example, if you are using Docker Compose, add the variable to the environment section:
aidbox:
  # ...
  environment:
    # ...
    AIDBOX_DD_API_KEY: 64977deeb1fff8e27763028e596a6856
Configure Datadog
Go to Logs -> Configuration
Click edit on Preprocessing for JSON logs
Set the attributes
| Name | Value |
|---|---|
| Date attribute | ts |
| Service attributes | tn |
| Status attributes | lvl |
| Trace Id attributes | ctx |
| Message attributes | msg,err |
Now add a facet for the event.
Go to logs then click add on the left
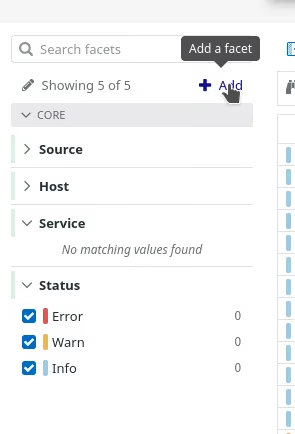
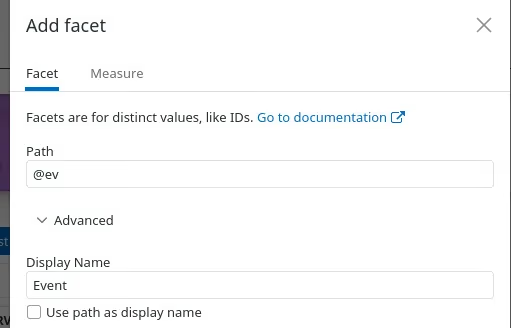
Use @ev path for the new facet
In this guide, we will add a metric for authorization failures
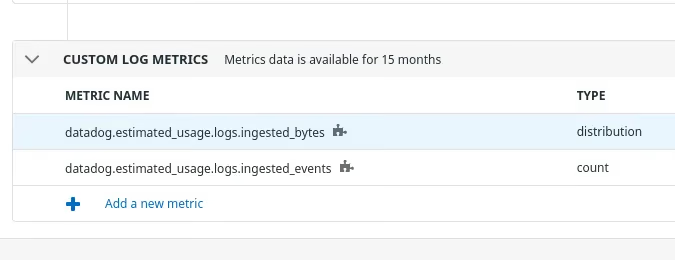
Go to Logs -> Generate Metrics
Click Add a new metric
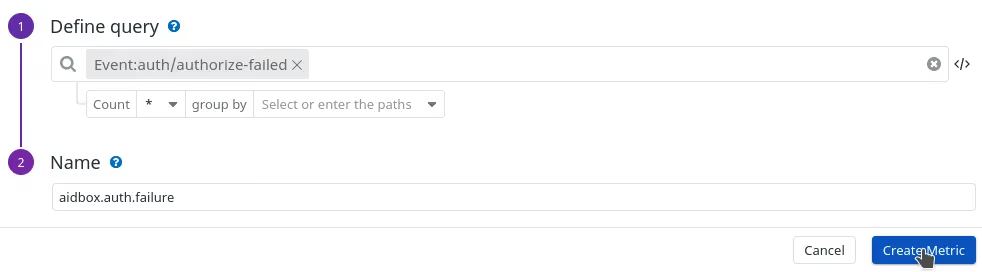
Define a query for the auth/authorize-failed event
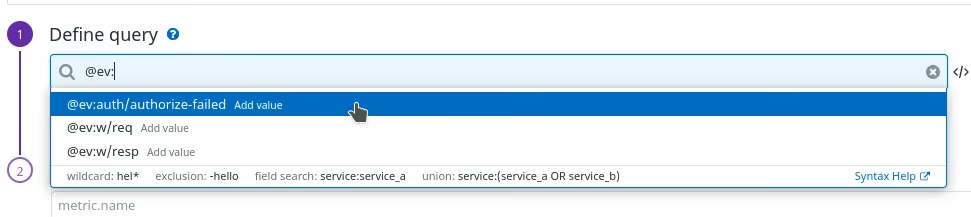
Enter the name for the new metric and click Create metric
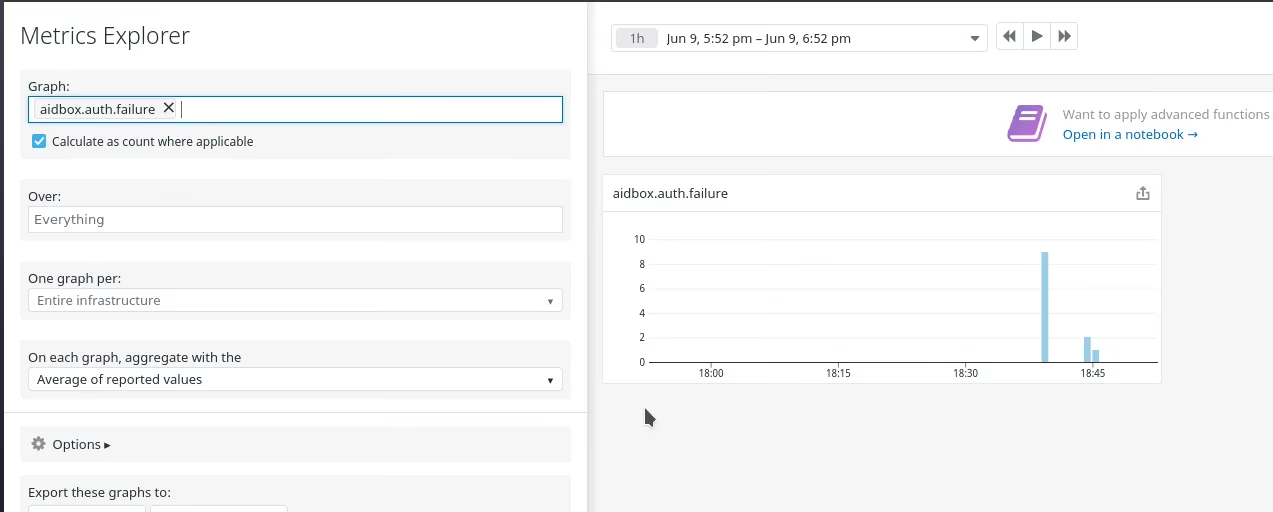
Now we can see our metric in the Metrics Explorer
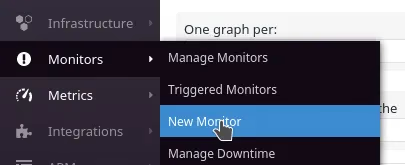
And we can define monitoring to alert if there are too many authorization failures. To do this navigate to Monitors -> New Monitor
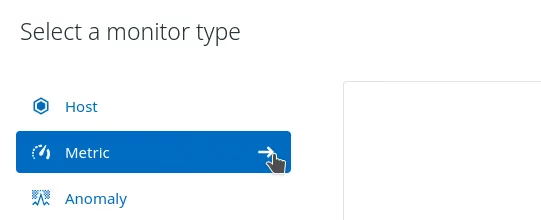
Select monitor type "metric"
Set up monitoring options
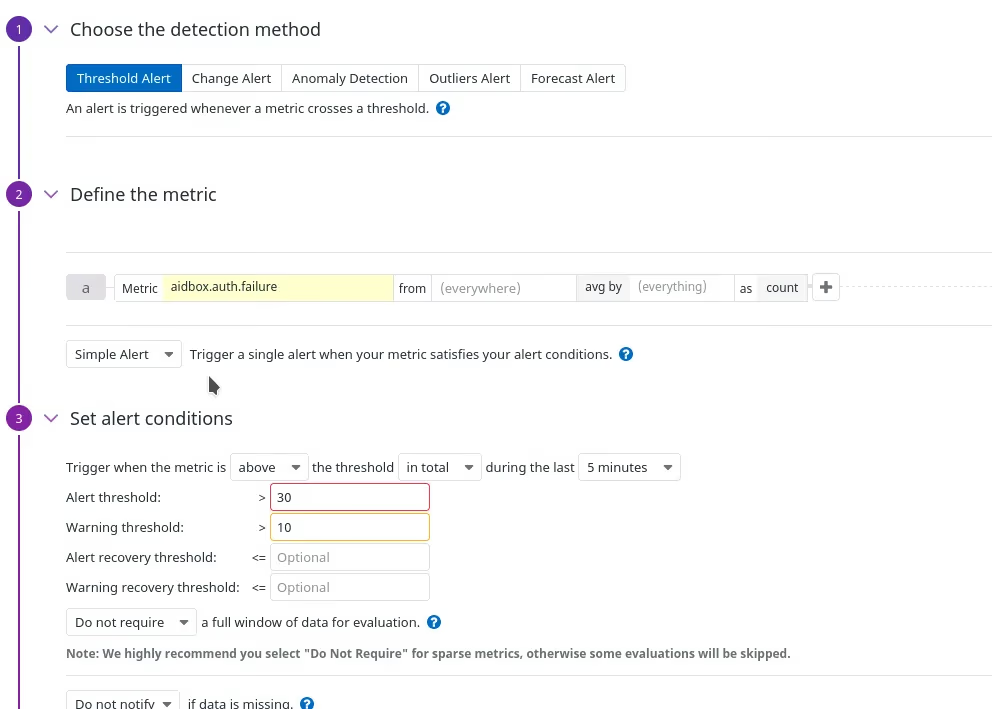
And notifications
Now we can see our monitor on the Monitor page
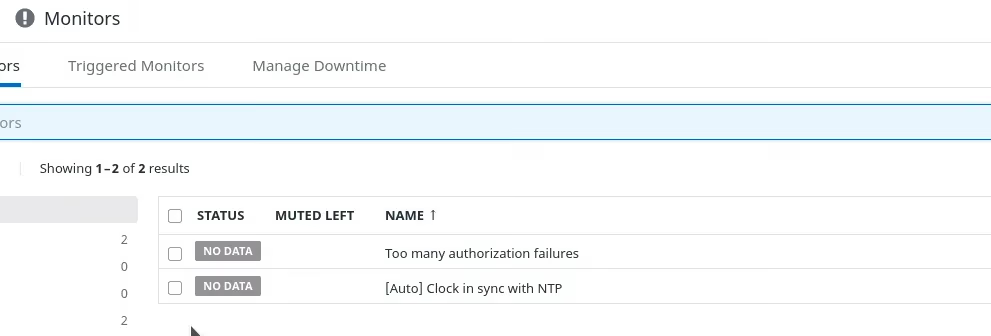
It takes some time for Datadog to set up the monitor. After a while, it will become green
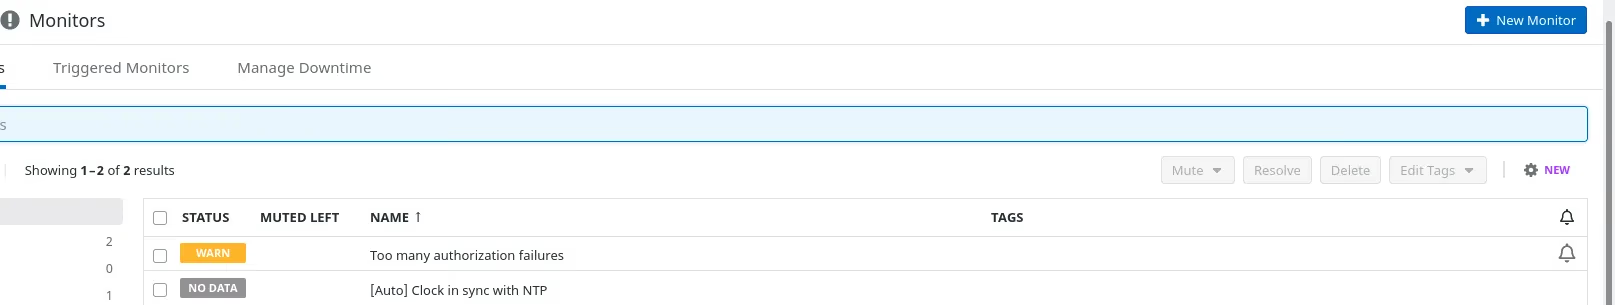
And when there are too many authorization failures in a short period of time, it changes the status to warning
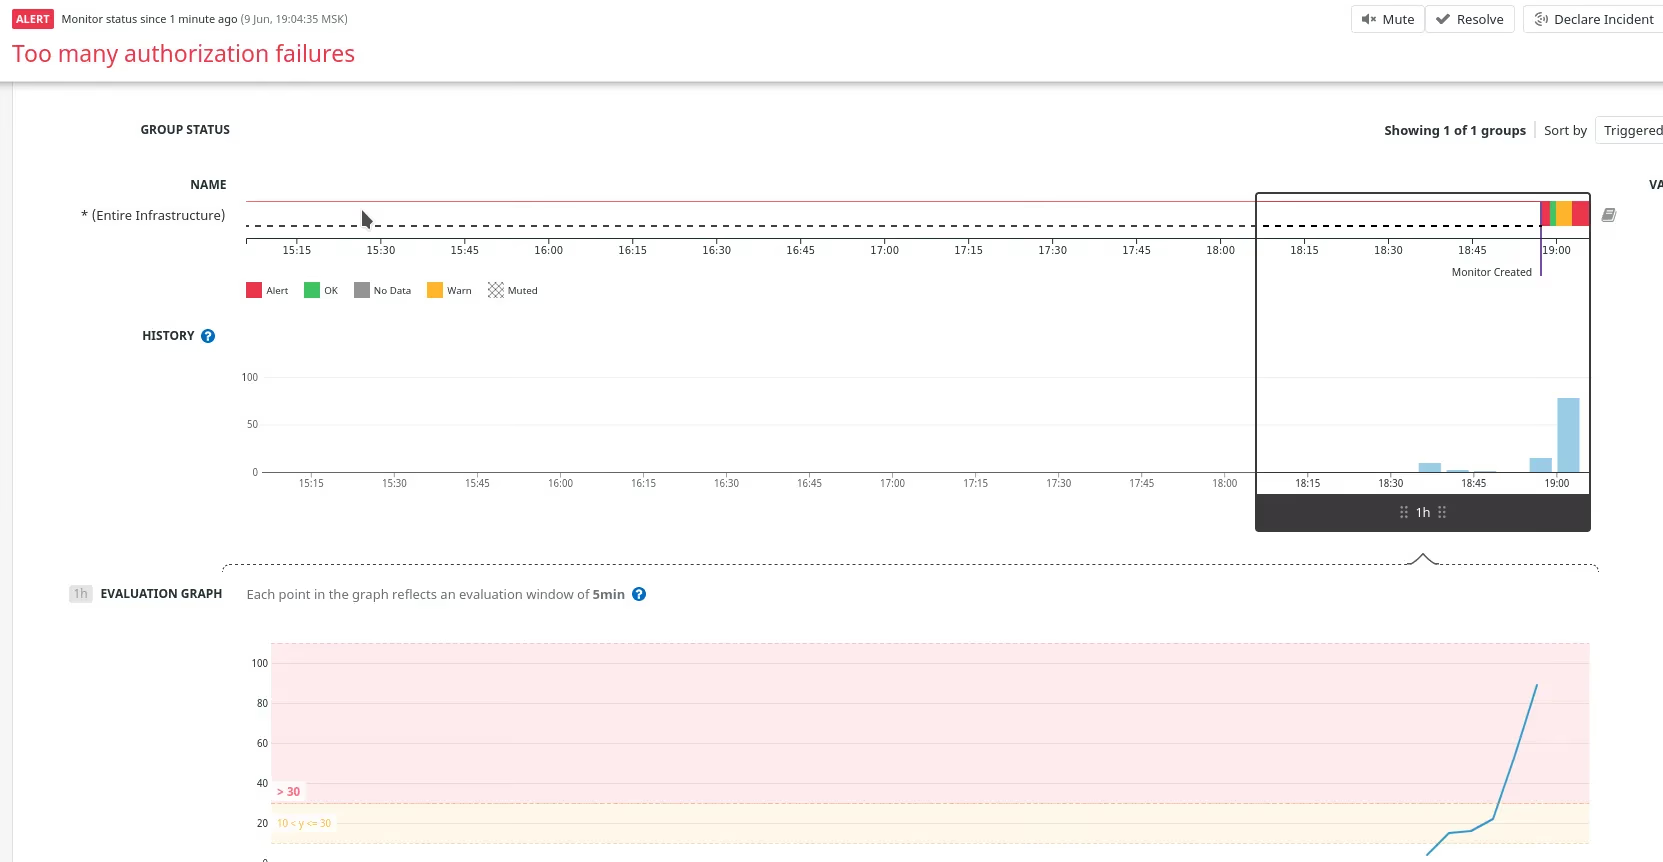
Then when it hits the threshold, the alert is created
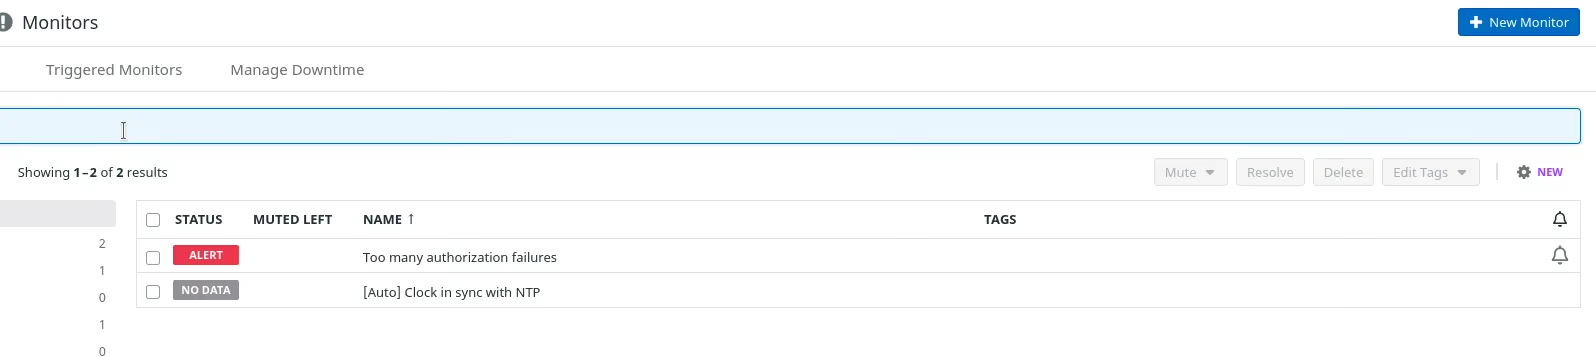
On the Monitor page, you can see statistics
By default Aidbox sends logs as bundles of multiple records so if there's not enough data you won't see any logs in Datadog. For testing purposes reduce bundle size to 1 record by setting environment variable:
AIDBOX_DD_BATCH_SIZE=1