---
description: Get up-to-speed with Aidbox observability features via interactive tutorials.
---
# Run Aidbox with OpenTelemetry locally
## Intro
This guide helps you to launch and explore the Aidbox observability features locally.
It introduces you to:
* The Aidbox installation process with Docker & Docker Compose,
* Logs & metrics & traces exporting to Elasticsearch & Prometheus & Zipkin using OpenTelemetry collector service.
{% hint style="warning" %}
Please **make sure** that both [Docker & Docker Compose](https://docs.docker.com/engine/install/) are installed.
{% endhint %}
### Prerequisites
* [Docker](https://www.docker.com/)
* Cloned repository: [Github: Aidbox/examples](https://github.com/Aidbox/examples/tree/main)
* Working directory: `OpenTelemetry`
To clone the repository and navigate to the `OpenTelemetry` directory, run:
```sh
git clone git@github.com:Aidbox/examples.git && cd examples/OpenTelemetry
```
### 1. Start Aidbox and demo components with Docker Compose
```shell
docker compose up --force-recreate
```
Wait until all components are pulled and started.
### 2. Activate Aidbox
Open Aidbox on [http://localhost:8080](http://localhost:8080) address, activate it, and login with `admin`/`password` credentials
### 3. Discover Aidbox logs with Kibana
Kibana should be available on [http://localhost:5602](http://localhost:5602) address. To see logs in Kibana we should
* make sure that logs are coming to Elasticsearch and then
* create a data view to observe over logs.
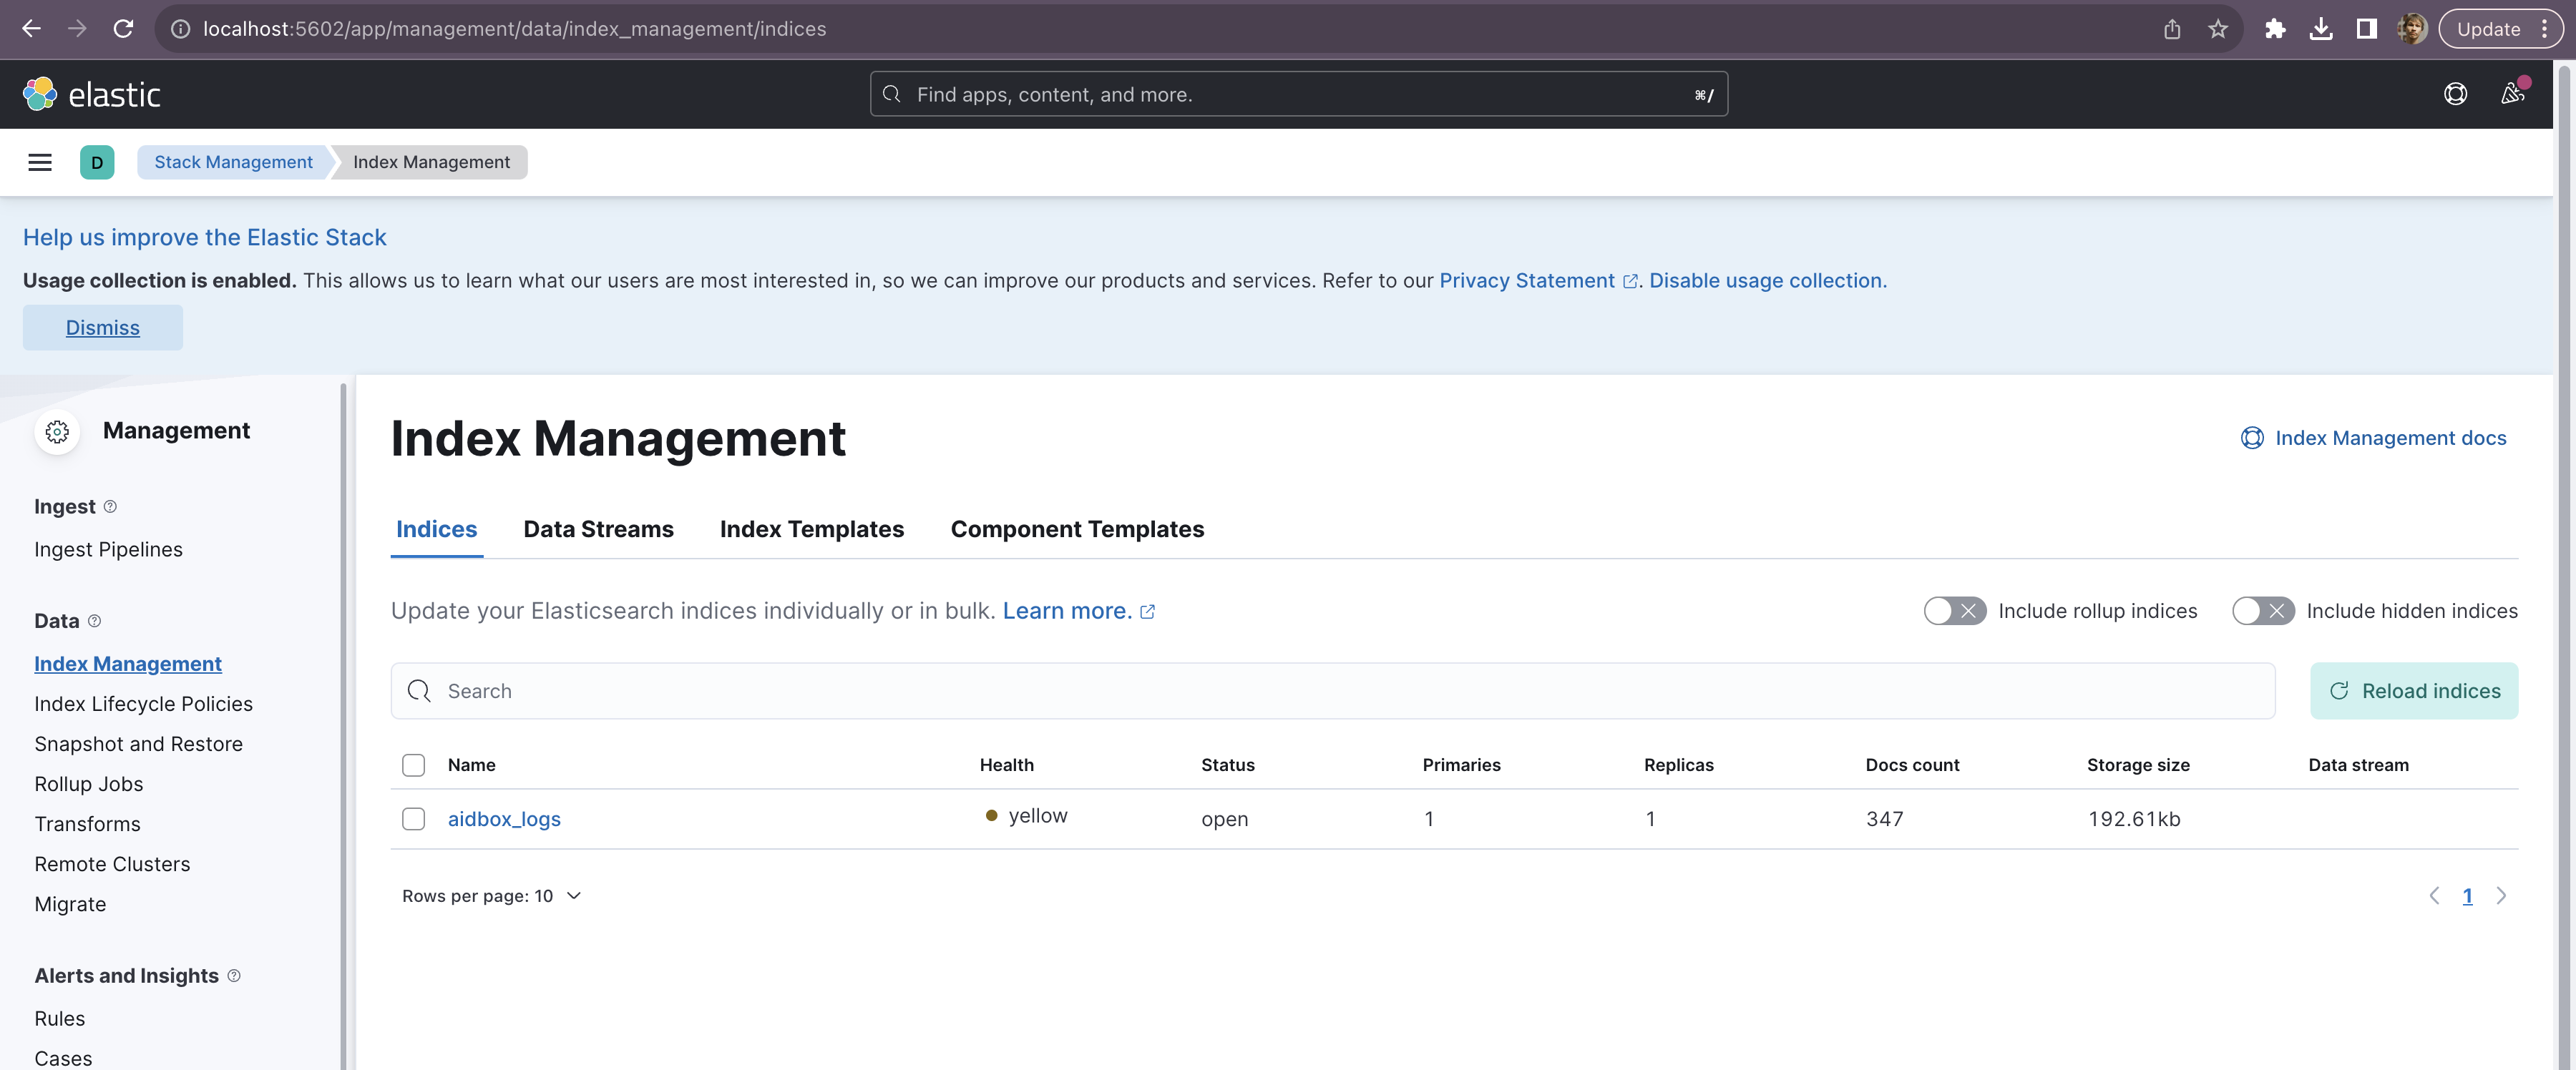
Go to [Index Management](http://localhost:5602/app/management/data/index_management/indices) page in Kibana (Menu → Stack Management → Index Management). You should see `aidbox_logs` index there.
Index management page
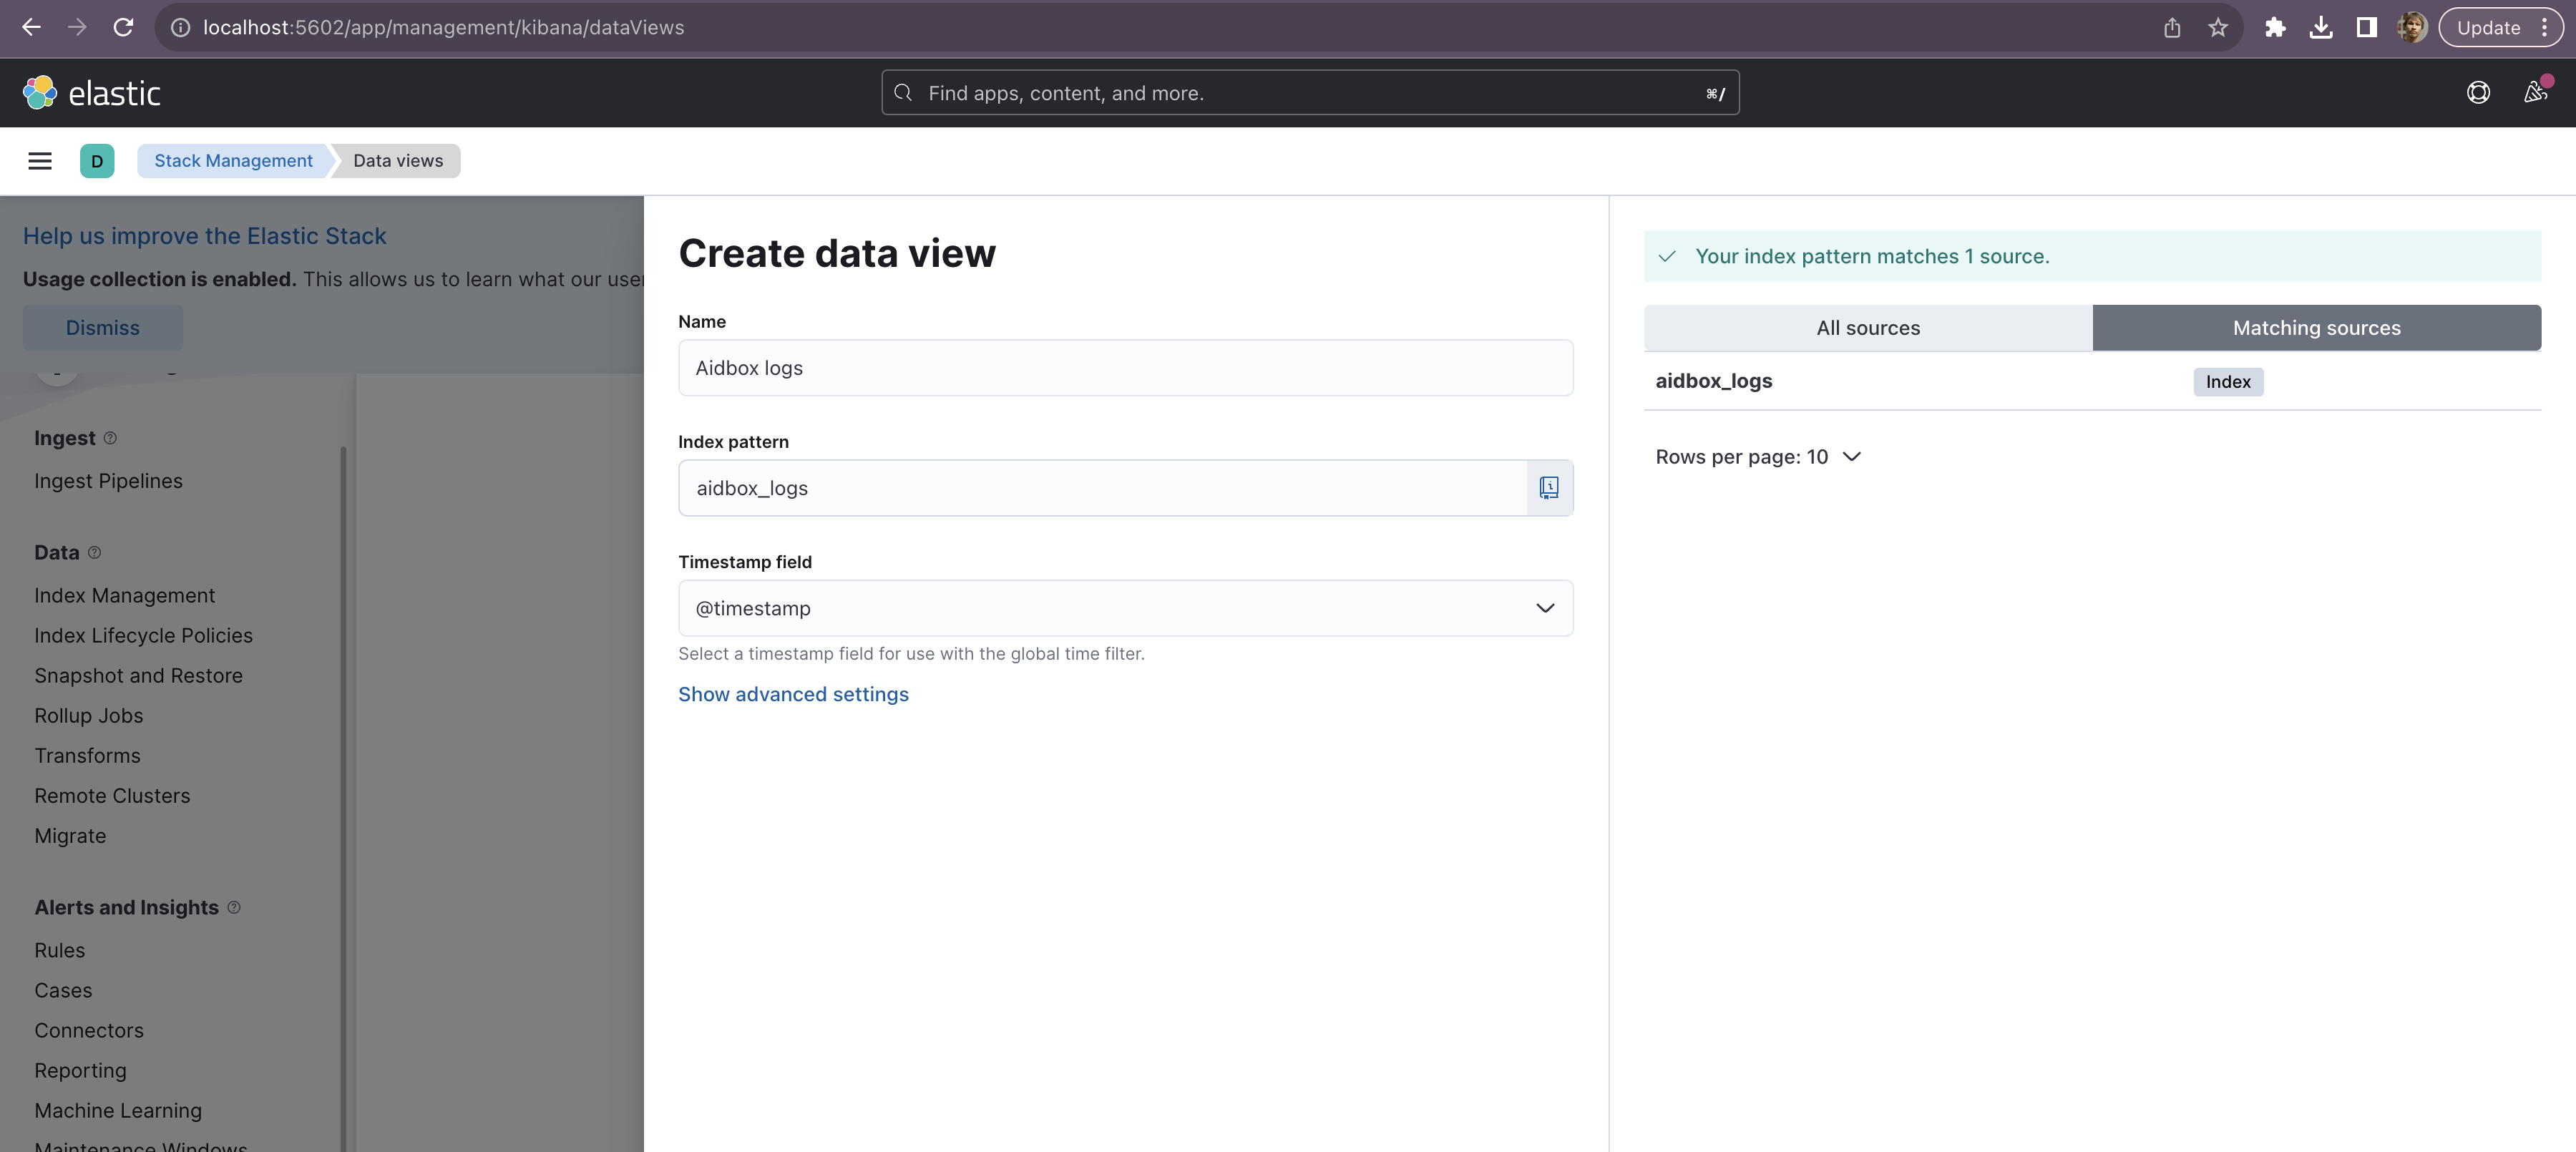
Then we should go to [Data Views](http://localhost:5602/app/management/kibana/dataViews) page (Menu → Stack Management → Data Views) and create a data view there.
Data view creation
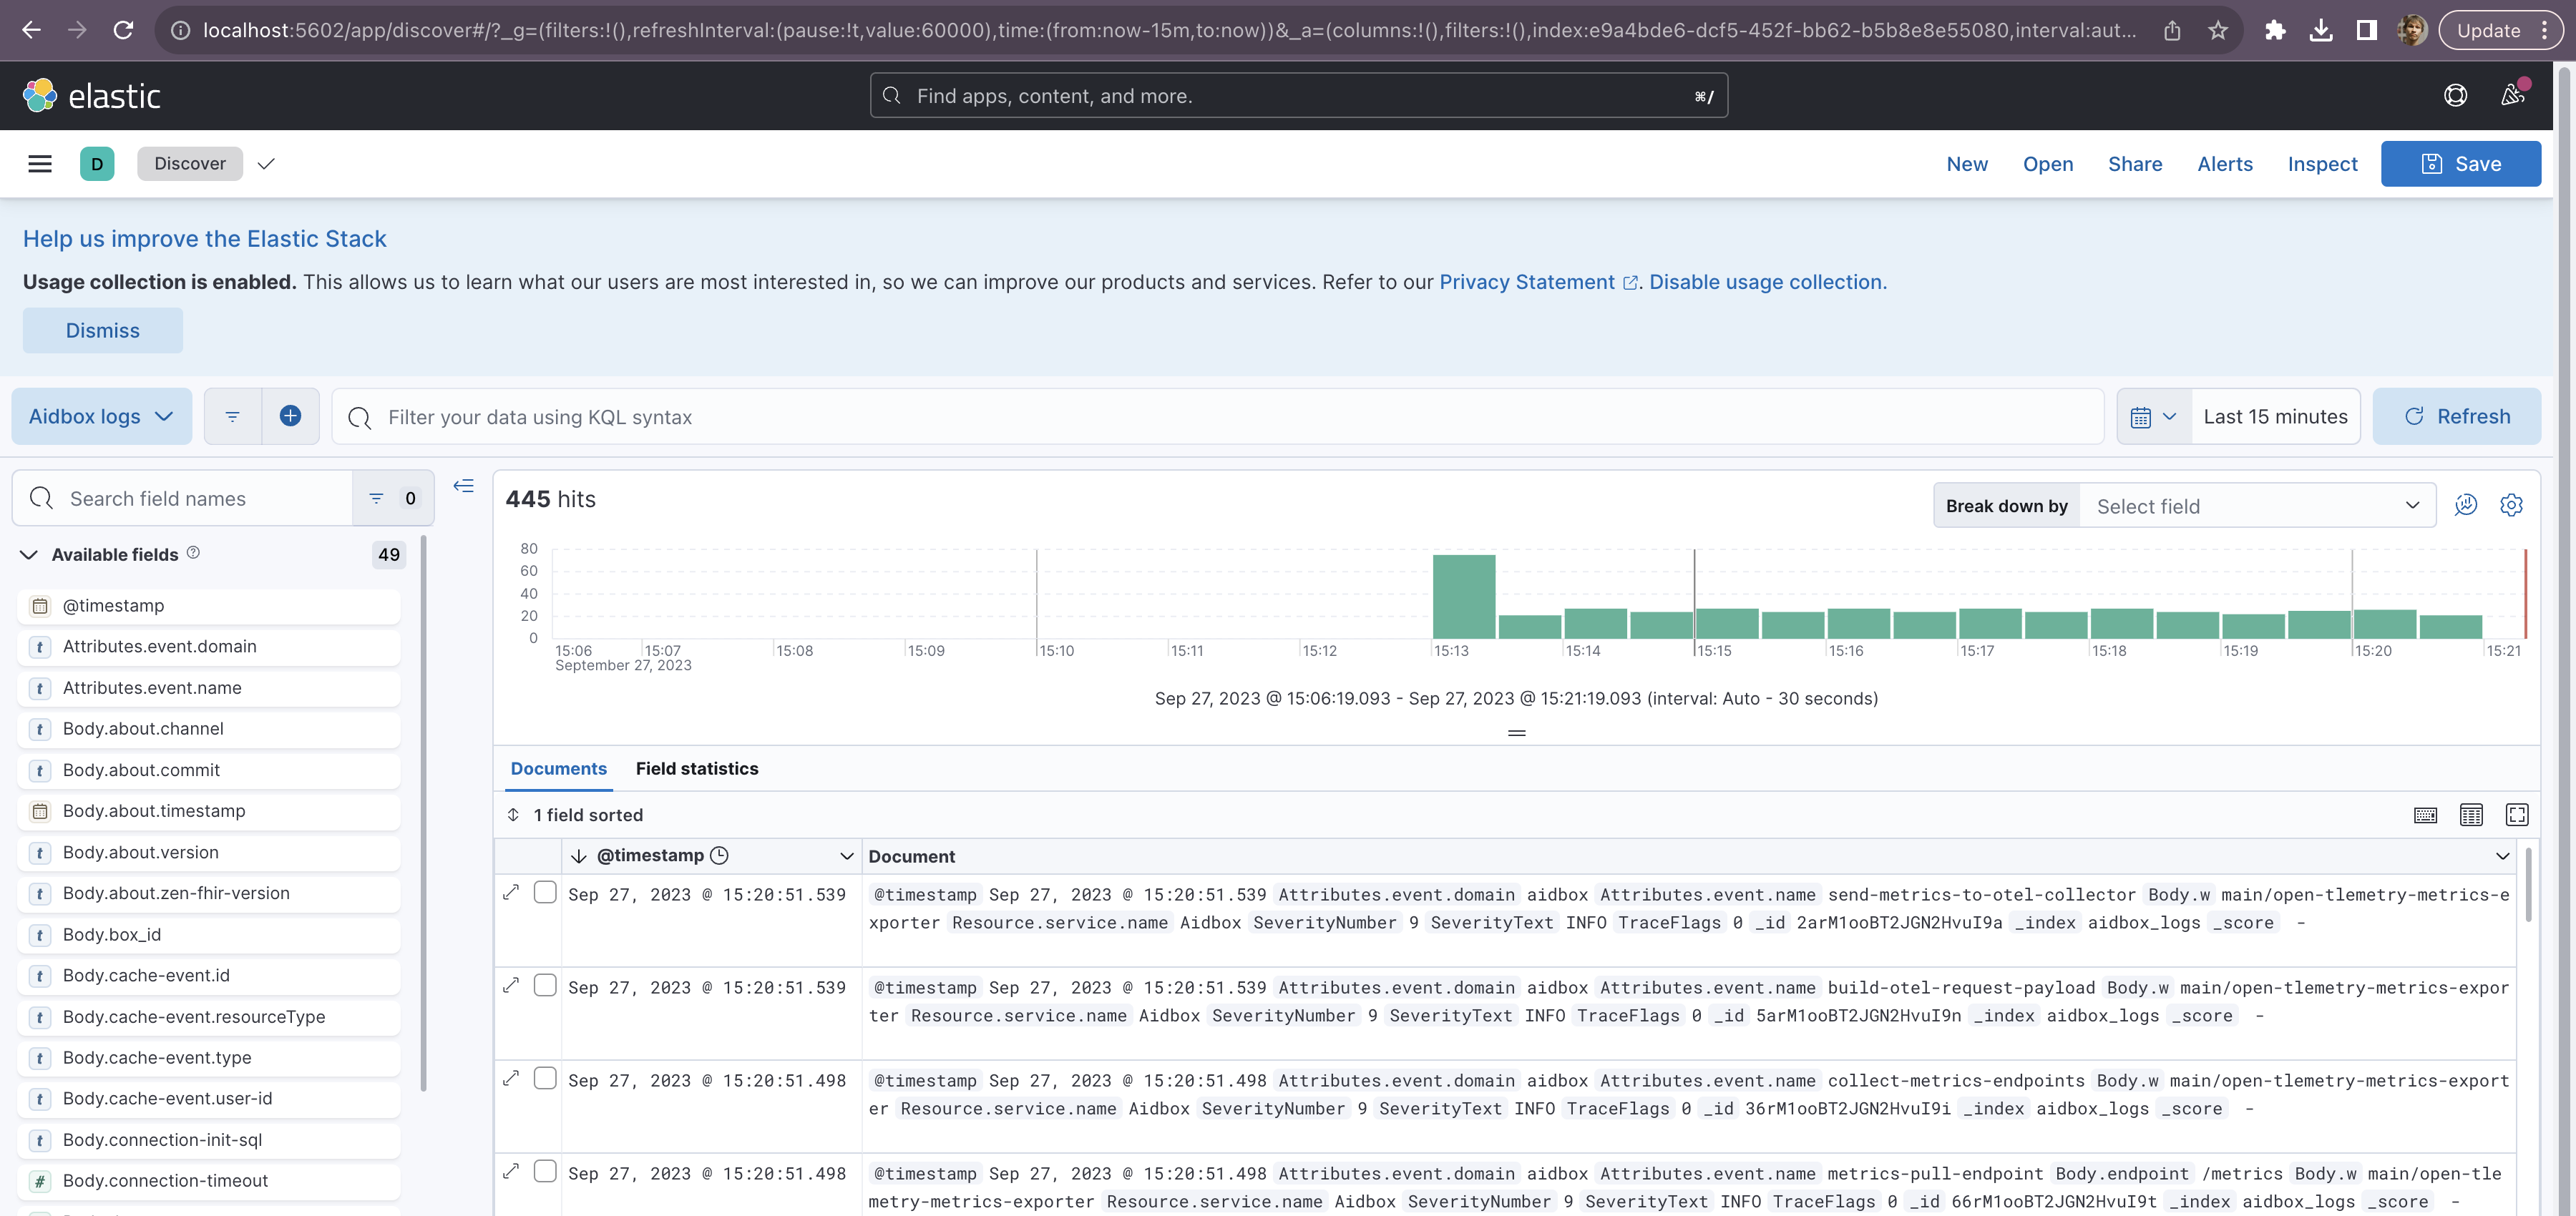
Then go to [Discover](http://localhost:5602/app/discover) page (Menu → Discover) and observe your logs.
Log discover page
### 4. Discover Aidbox metrics with Grafana
Grafana should be available on [http://localhost:3001](http://localhost:3001) address, login with `admin`/`password` credentials.
Grafana LogIn
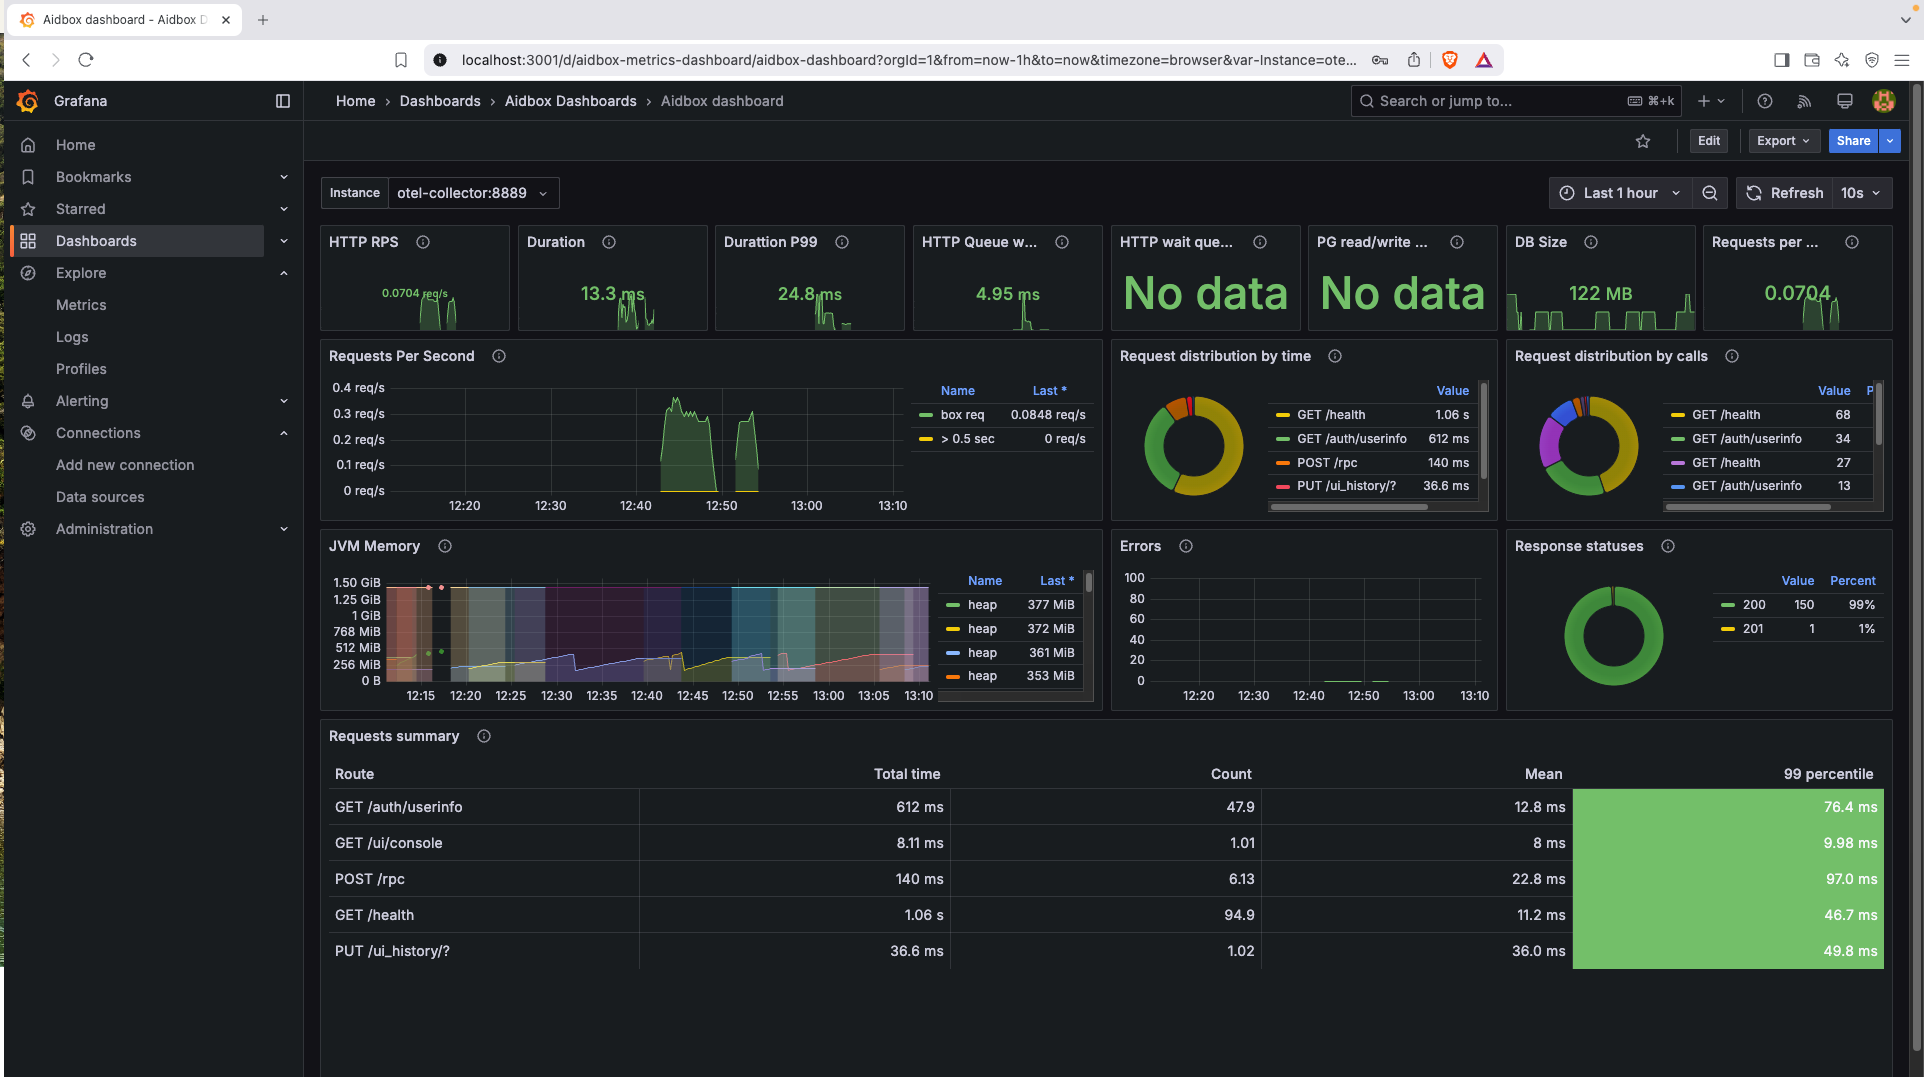
Navigate to `Dashboards->Aidbox Dashboards->Aidbox Dashboard` to see the dashboard. You probably need to wait for a while until the data is collected.
Grafana Dashboard
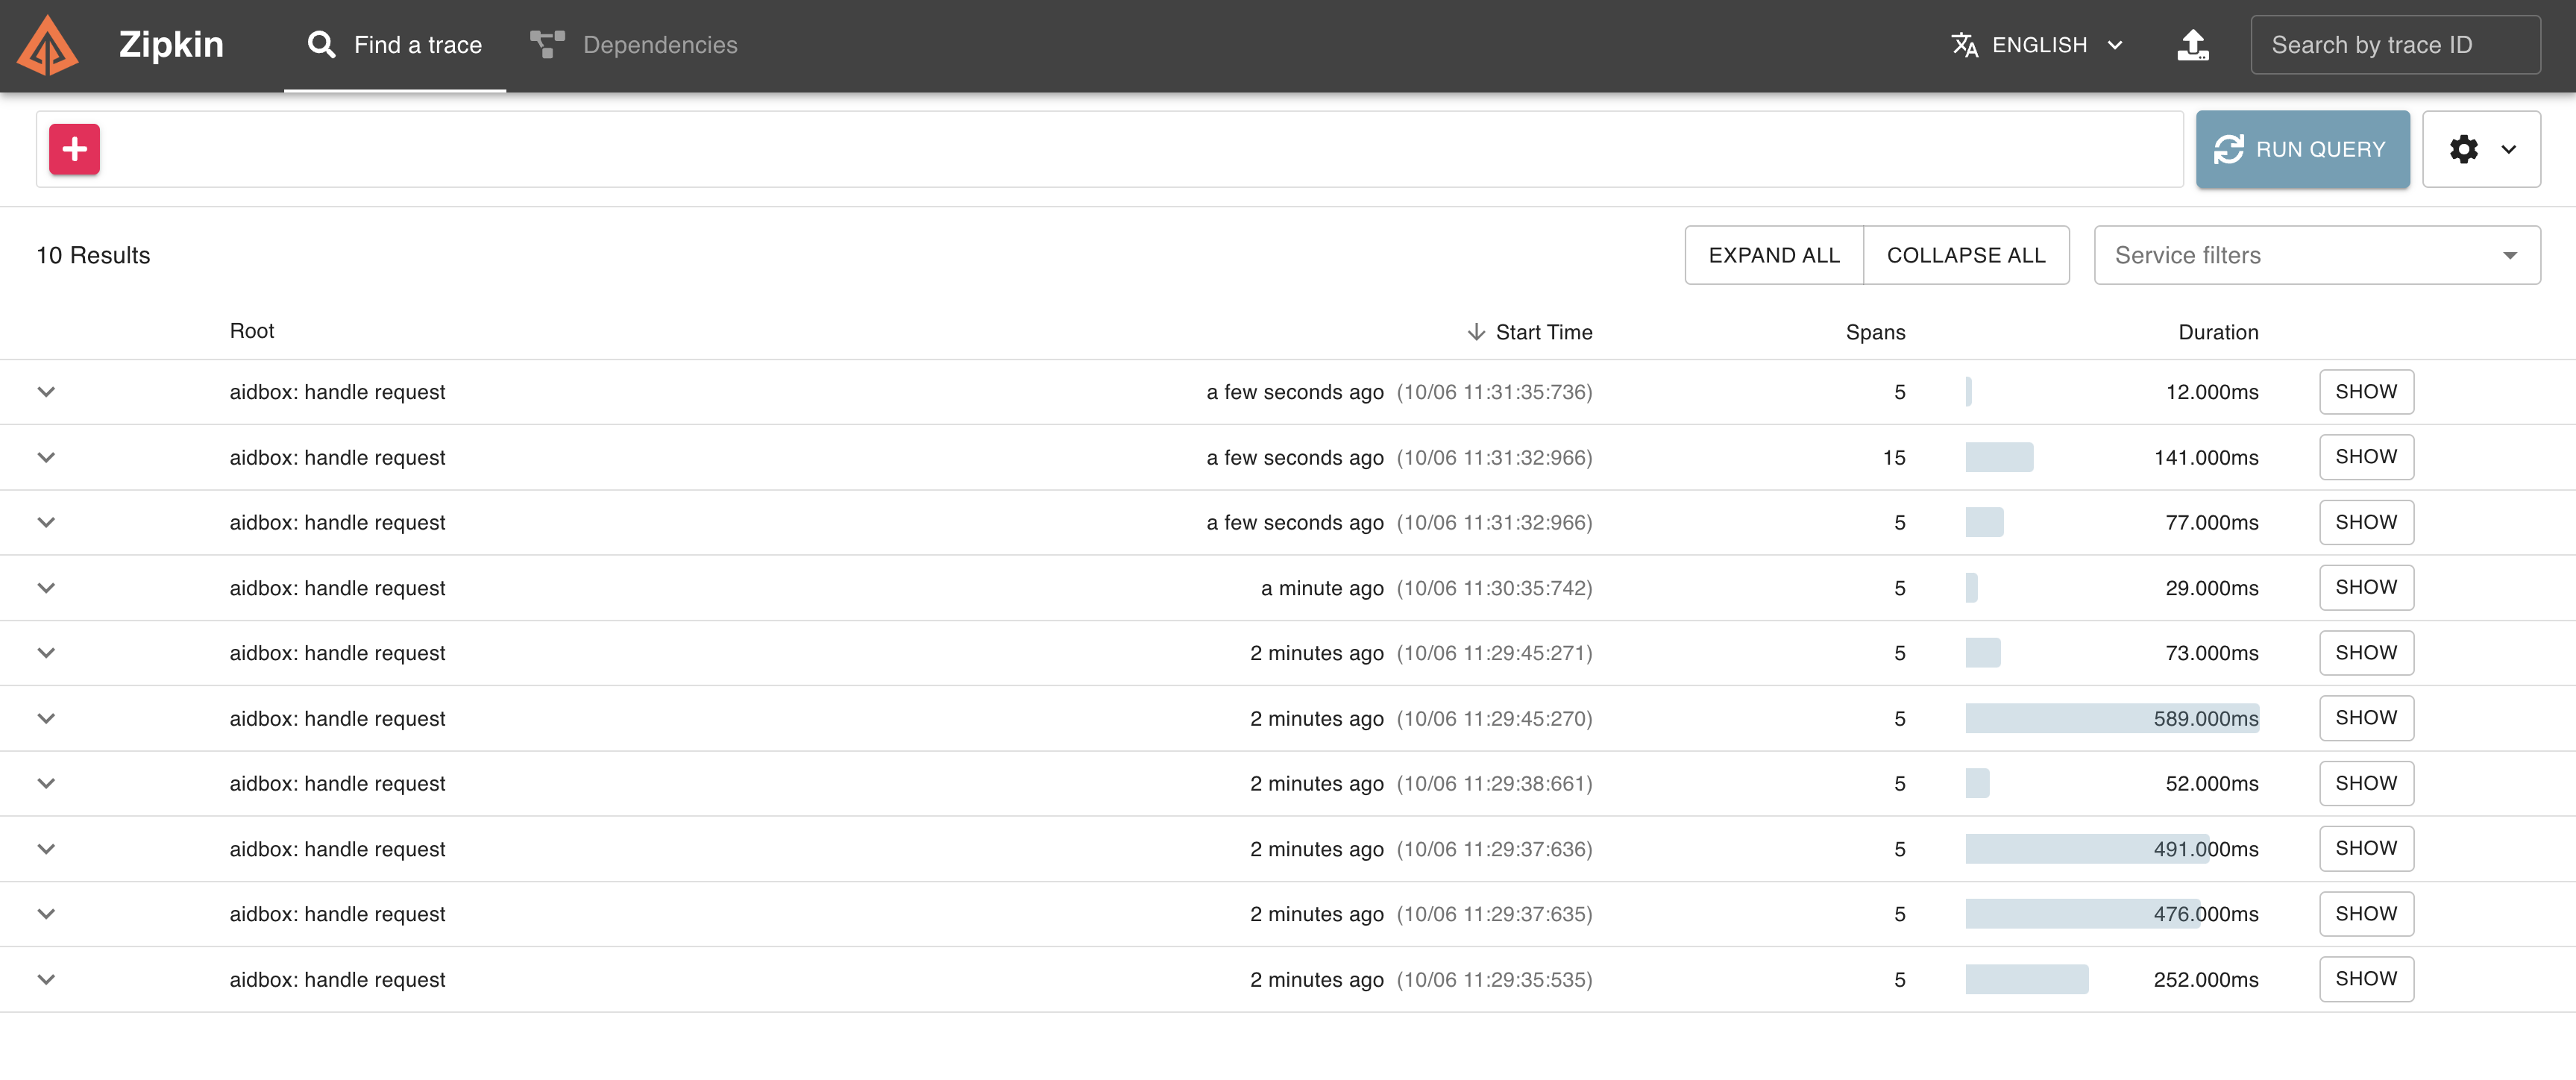
### 5. Discover Aidbox traces with Zipkin
Zipkin should be available on [http://localhost:9411/](http://localhost:9411/zipkin/) address. To see traces in Zipkin click the `Run query` button.
Traces list in Zipkin
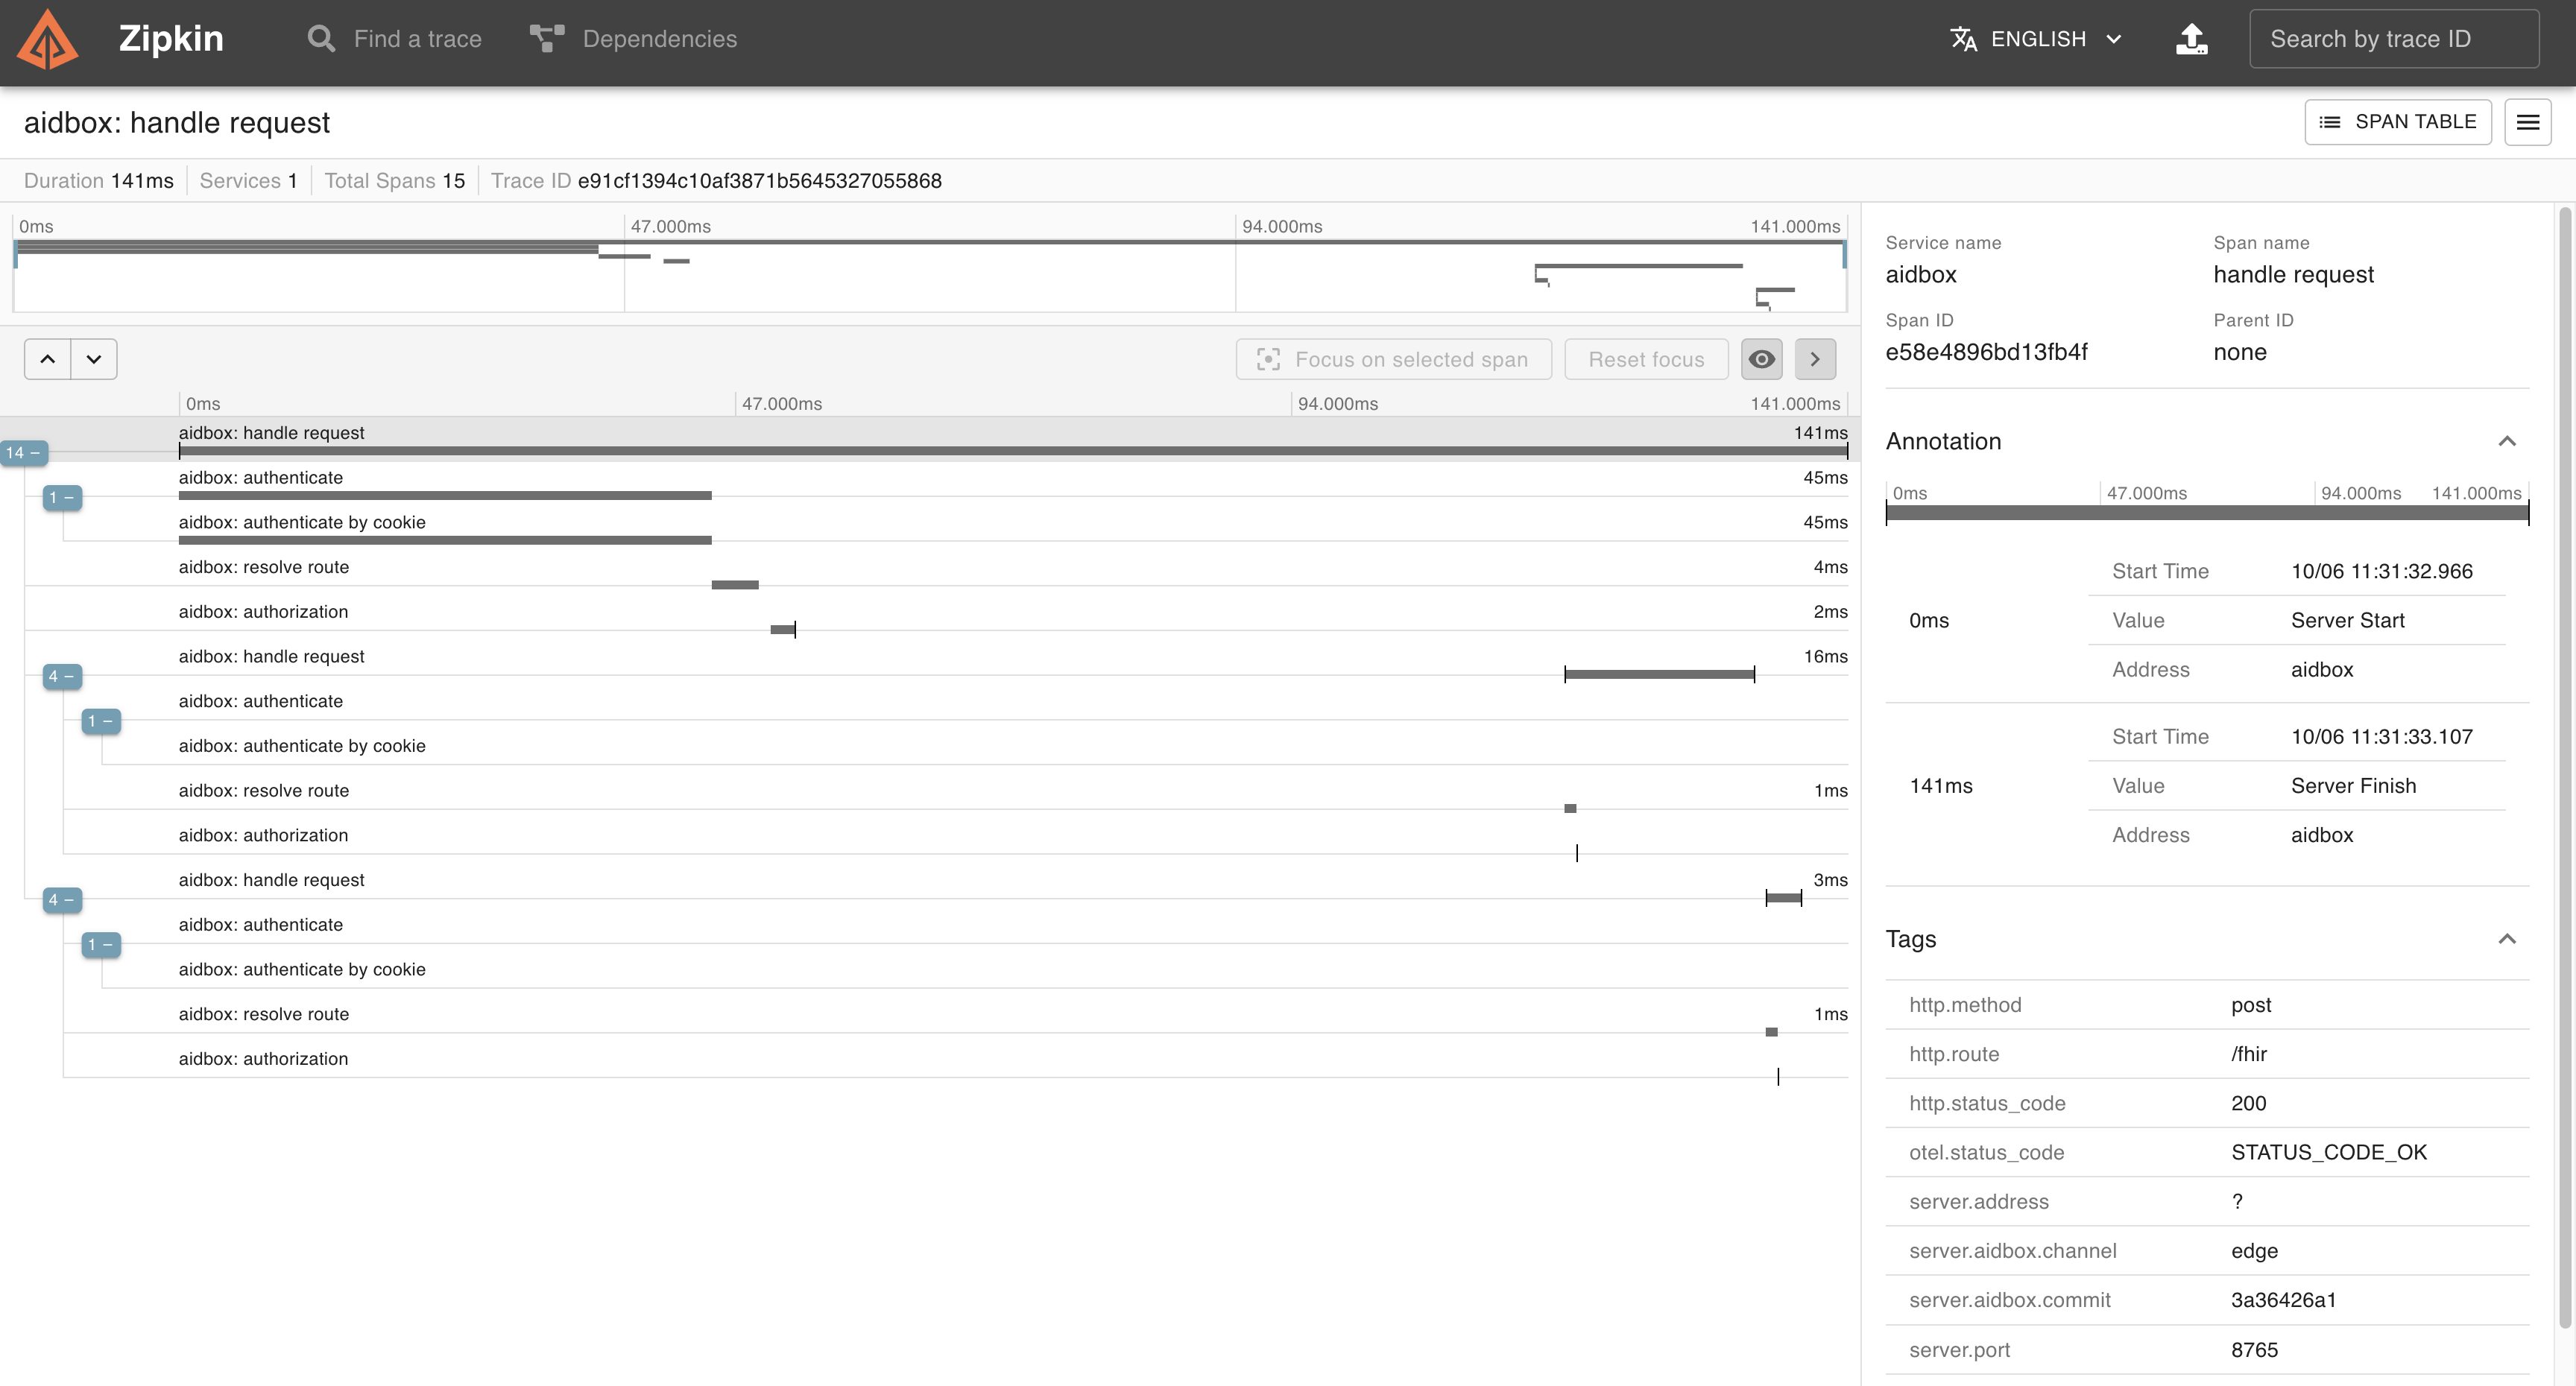
Click the `Show` button to see all spans of a certain request.
Trace view in Zipkin
## Next Steps
* Learn more about [Aidbox Configuration](../../../deprecated/deprecated/zen-related/aidbox-zen-lang-project/)
.png)
.png) Please **make sure** that both [Docker & Docker Compose](https://docs.docker.com/engine/install/) are installed.
{% endhint %}
### Prerequisites
* [Docker](https://www.docker.com/)
* Cloned repository: [Github: Aidbox/examples](https://github.com/Aidbox/examples/tree/main)
* Working directory: `OpenTelemetry`
To clone the repository and navigate to the `OpenTelemetry` directory, run:
```sh
git clone git@github.com:Aidbox/examples.git && cd examples/OpenTelemetry
```
### 1. Start Aidbox and demo components with Docker Compose
```shell
docker compose up --force-recreate
```
Wait until all components are pulled and started.
### 2. Activate Aidbox
Open Aidbox on [http://localhost:8080](http://localhost:8080) address, activate it, and login with `admin`/`password` credentials
### 3. Discover Aidbox logs with Kibana
Kibana should be available on [http://localhost:5602](http://localhost:5602) address. To see logs in Kibana we should
* make sure that logs are coming to Elasticsearch and then
* create a data view to observe over logs.
Go to [Index Management](http://localhost:5602/app/management/data/index_management/indices) page in Kibana (Menu → Stack Management → Index Management). You should see `aidbox_logs` index there.
Please **make sure** that both [Docker & Docker Compose](https://docs.docker.com/engine/install/) are installed.
{% endhint %}
### Prerequisites
* [Docker](https://www.docker.com/)
* Cloned repository: [Github: Aidbox/examples](https://github.com/Aidbox/examples/tree/main)
* Working directory: `OpenTelemetry`
To clone the repository and navigate to the `OpenTelemetry` directory, run:
```sh
git clone git@github.com:Aidbox/examples.git && cd examples/OpenTelemetry
```
### 1. Start Aidbox and demo components with Docker Compose
```shell
docker compose up --force-recreate
```
Wait until all components are pulled and started.
### 2. Activate Aidbox
Open Aidbox on [http://localhost:8080](http://localhost:8080) address, activate it, and login with `admin`/`password` credentials
### 3. Discover Aidbox logs with Kibana
Kibana should be available on [http://localhost:5602](http://localhost:5602) address. To see logs in Kibana we should
* make sure that logs are coming to Elasticsearch and then
* create a data view to observe over logs.
Go to [Index Management](http://localhost:5602/app/management/data/index_management/indices) page in Kibana (Menu → Stack Management → Index Management). You should see `aidbox_logs` index there.